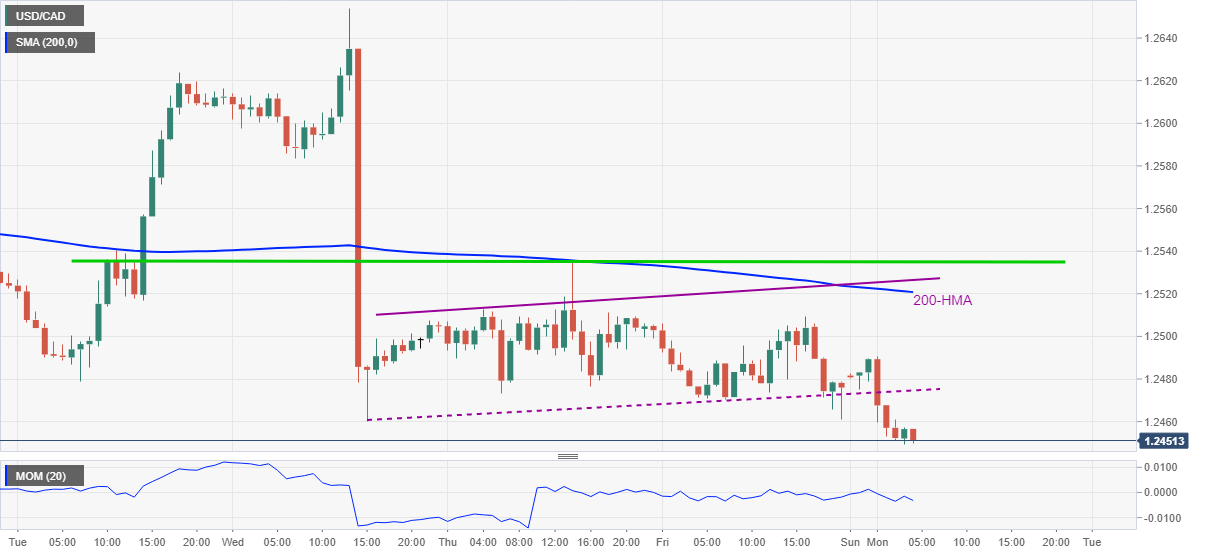
- USD/CAD takes offers around the lowest since March 18.
- Confirmation of bearish chart pattern, sustained trading below 200-HMA back sellers.
- Bulls need a decisive break above 1.2540 for fresh entry.
USD/CAD drops to the fresh low in five weeks while flashing 1.2450 figures on the chart, down 0.19% intraday, while heading into Monday’s European session.
The pair’s sustained drop below a three-day-long ascending trend channel, part of the said formation, confirms the bearish flag and directs the quote further towards the south.
Although February 2018 low surrounding 1.2255 appears as the theoretical choice on the bearish flag breakdown, the yearly bottom close to 1.2365 may offer an intermediate halt during the south-run.
During the quote’s corrective pullback, which is less likely considering the Momentum indicator and a sustained break of a bearish chart pattern, the stated channel’s support line near 1.2475 becomes the nearby hurdle to watch.
However, any further recovery beyond 1.2475 needs to cross the 200-HMA level of 1.2520, not to forget the channel’s upper line near 1.2530, before challenging a one-week-old horizontal resistance near 1.2540.
USD/CAD hourly chart
Trend: Bearish

