Prices breaking below its 100 hour moving average
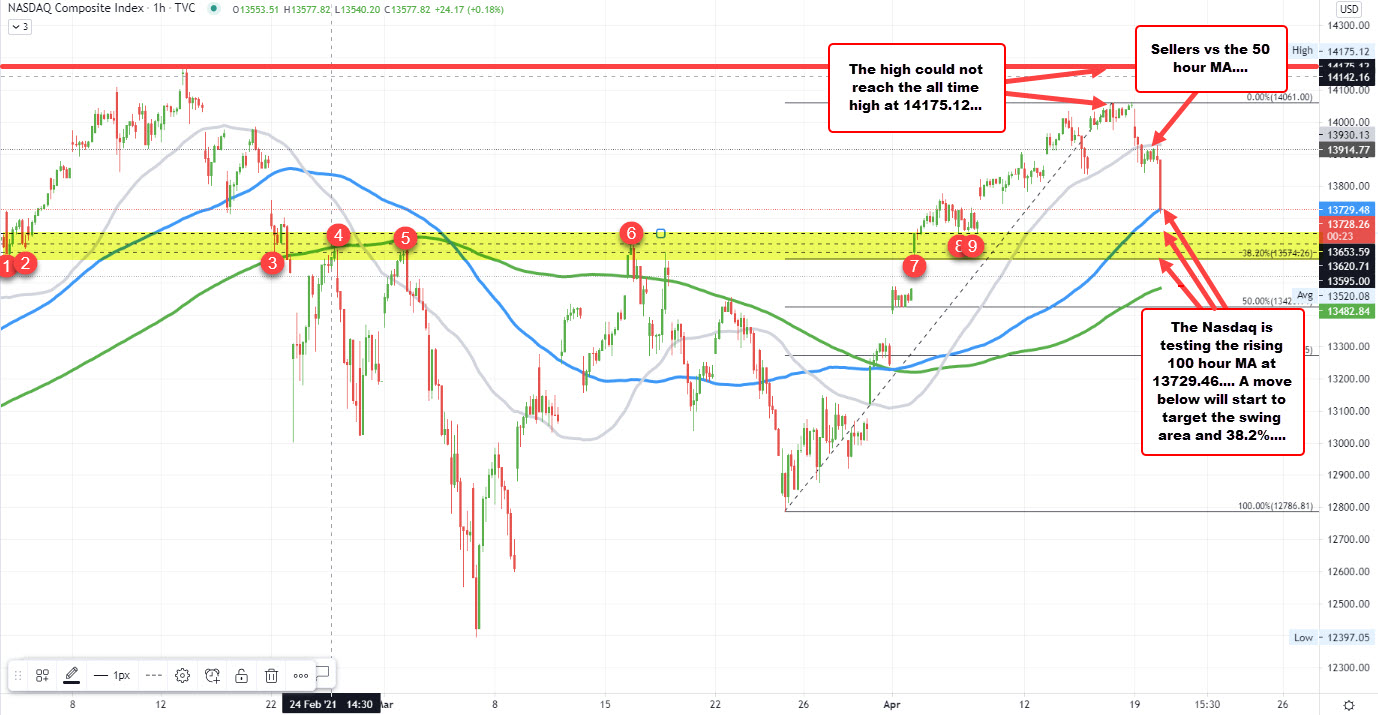
The NASDAQ index is now down over 200 points or more close to -1.5% at 13706.65. The last push to the downside has now taken the price comfortably below its 100 hour moving average at 13729.48. Stay below that moving average will keep the bearish tilt for the index.
Looking at the hourly chart above, the next target area comes between the 38.2% retracement at 13574 and swing levels between 13595 and 13653. That area was home to swing highs going back to February 24, March 1 and again on March 16 and March 17 before breaking higher in early April.
This article was originally published by Forexlive.com. Read the original article here.