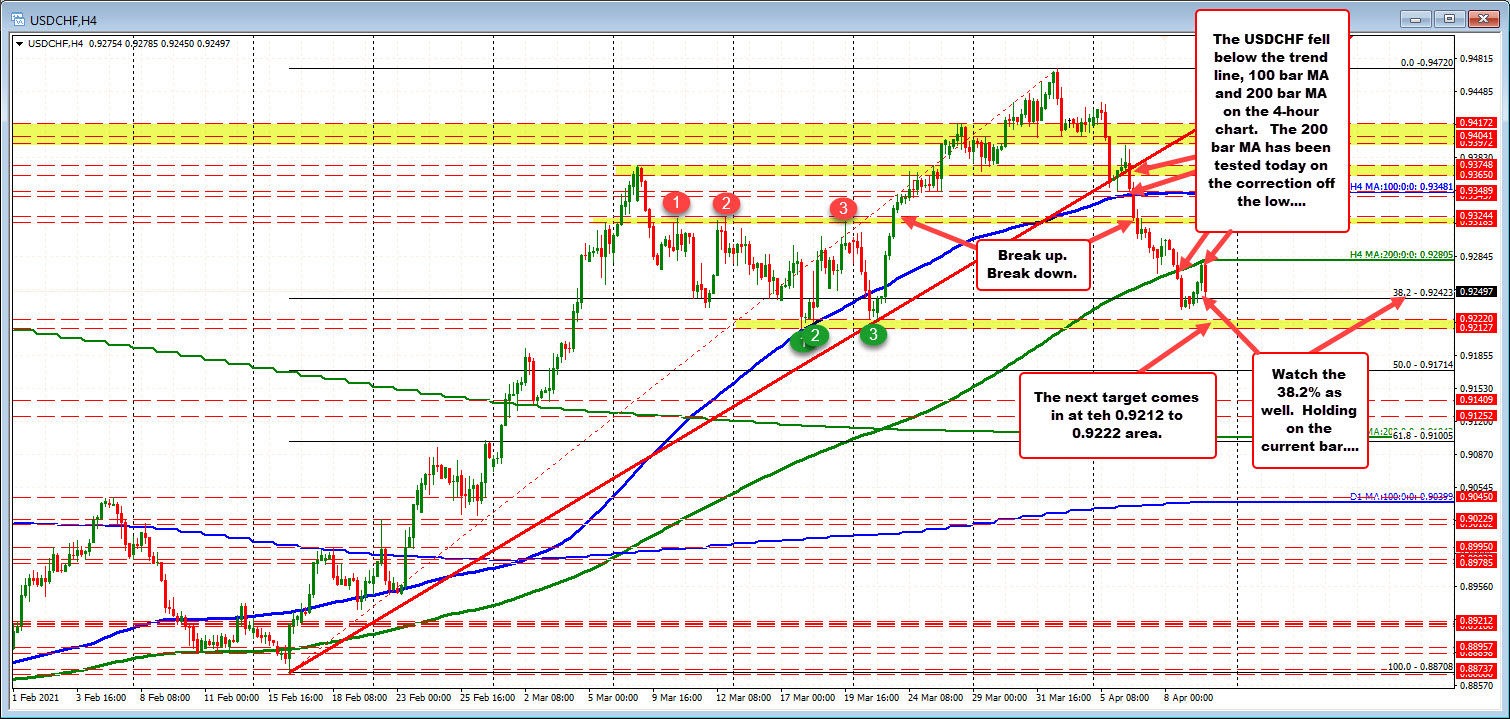
4 hour chart shows the progression lower.
The USDCHF this week trended lower and along the way, cracked below some downside technical levels.
Looking at the 4-hour chart above, the price started the technical breaks below an upward sloping trend line, fell below the 100 bar MA (blue line) and then the 200 bar MA (green line). The 38.2% of the move up from Feb 16 low was also broken at 0.9242 level, but stalled ahead of the swing lows from March 17 and March 22 between 0.92127 and 0.9222. The low this week reached 0.92318 yesterday.
Today, the price has moved higher, BUT the high price stalled against the 200 bar MA (green line) currently at 0.92805. The price has moved back down.
What next?
The 38.2% has been able to hold support on the current 4-hour bar at 0.92423. A move below that level would next target the next swing area between 0.92127 to 0.9222. Move below that level, and it opens the door toward the 50% retracement at 0.91714.
Conversely, if the 38.2% holds (or a move below goes no where), we could see buyers reenter with the idea that the market corrected around 38.2% – correction over. Getting back above the 200 bar MA at 0.92805 would be the next hurdle if that is the market decision.