What the charts are saying now and going into next week’s trading
The US dollar is modestly higher after the better than expected jobs report but off the initial spike levels.
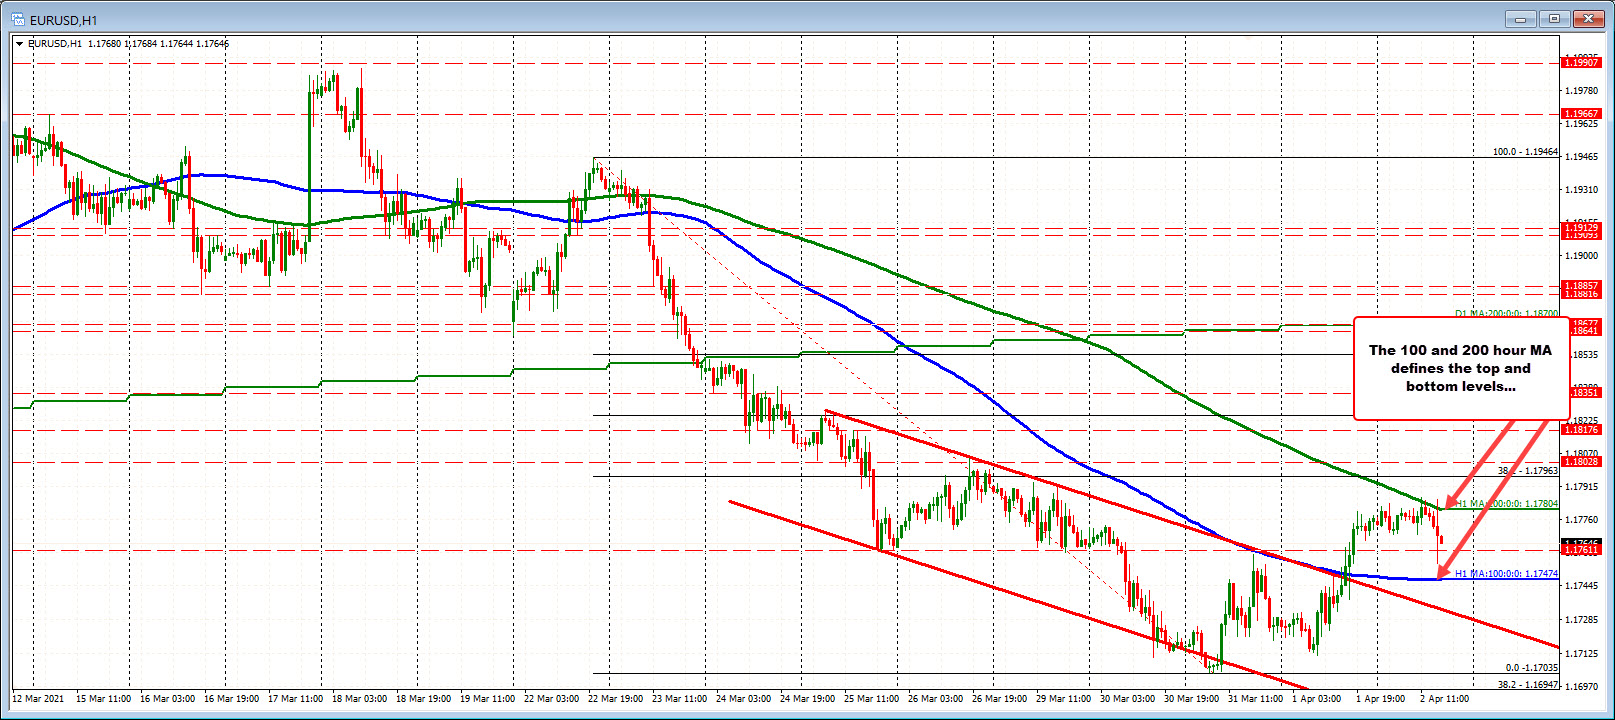
EURUSD: The EURUSD fell to a low of 1.1755 but has bounced back to 1.1768 currently. The pair trades between the 200 hour MA above at 1.1780 and the 100 hour MA below at 1.17474
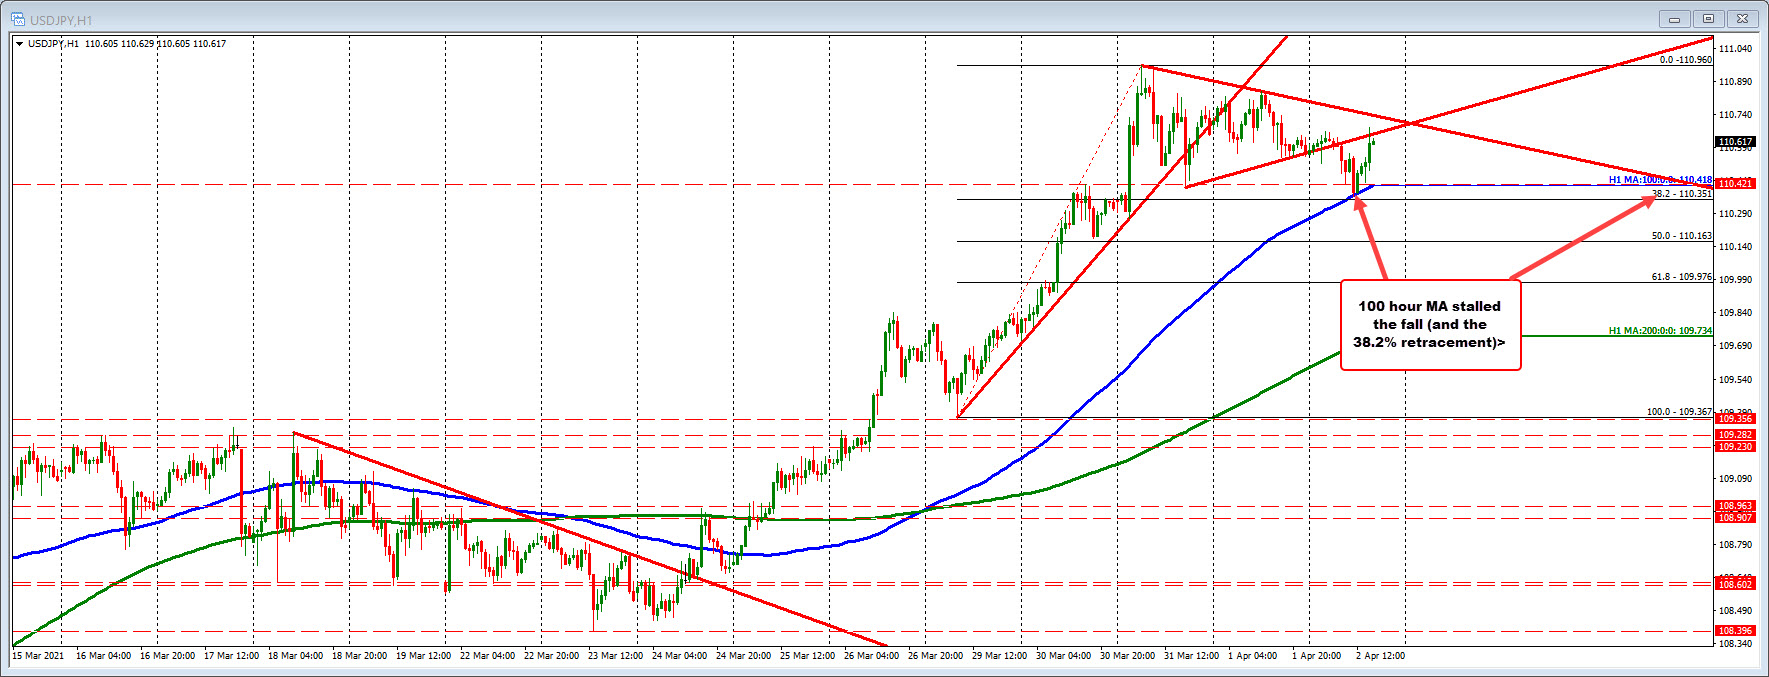
USDJPY: The USDJPY moved back to to a new session high at 110.679. The high in the Asian session was at 110.662. The pair is at 110.62 currently. At the low today, the price held against the 100 hour MA (blue line) and the 38.2% retracement at 110.351.
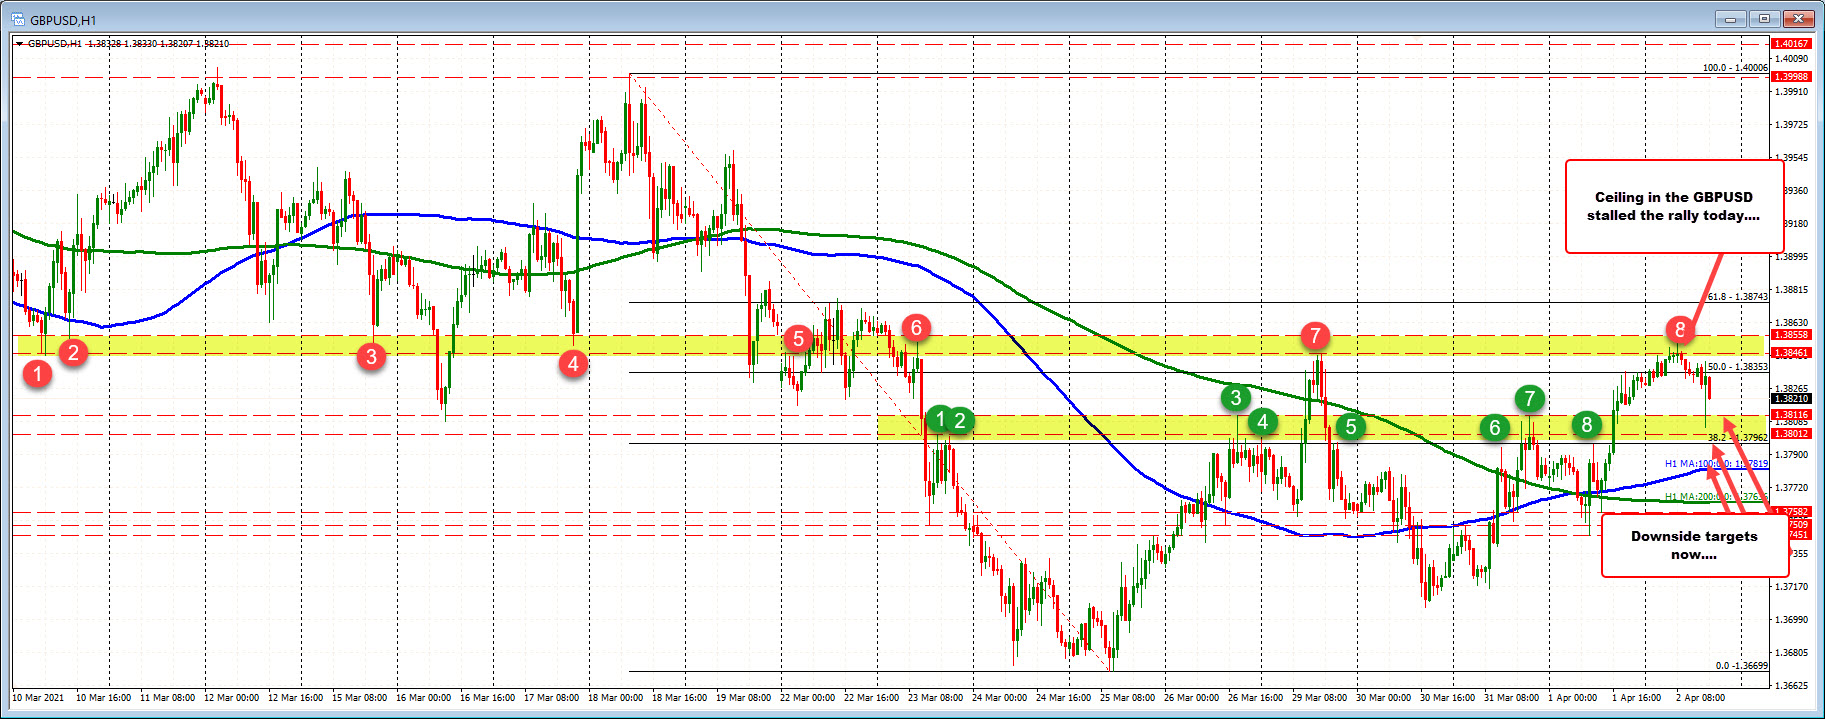
GBPUSD: The GBPUSD moved down to a low of 1.3805 after the report and moved back modestly higher. The pair trades at 1.3817 currently. At the high today, the price moved above the 50% retracement but stalled in a swing area between 1.3846 to 1.38558. The 1.38558 was the high from earlier this week. On the downside, the pair has stalled in another swing area between 1.3801 to 1.38116 (see green numbered circles). Those swing areas will define the boundaries
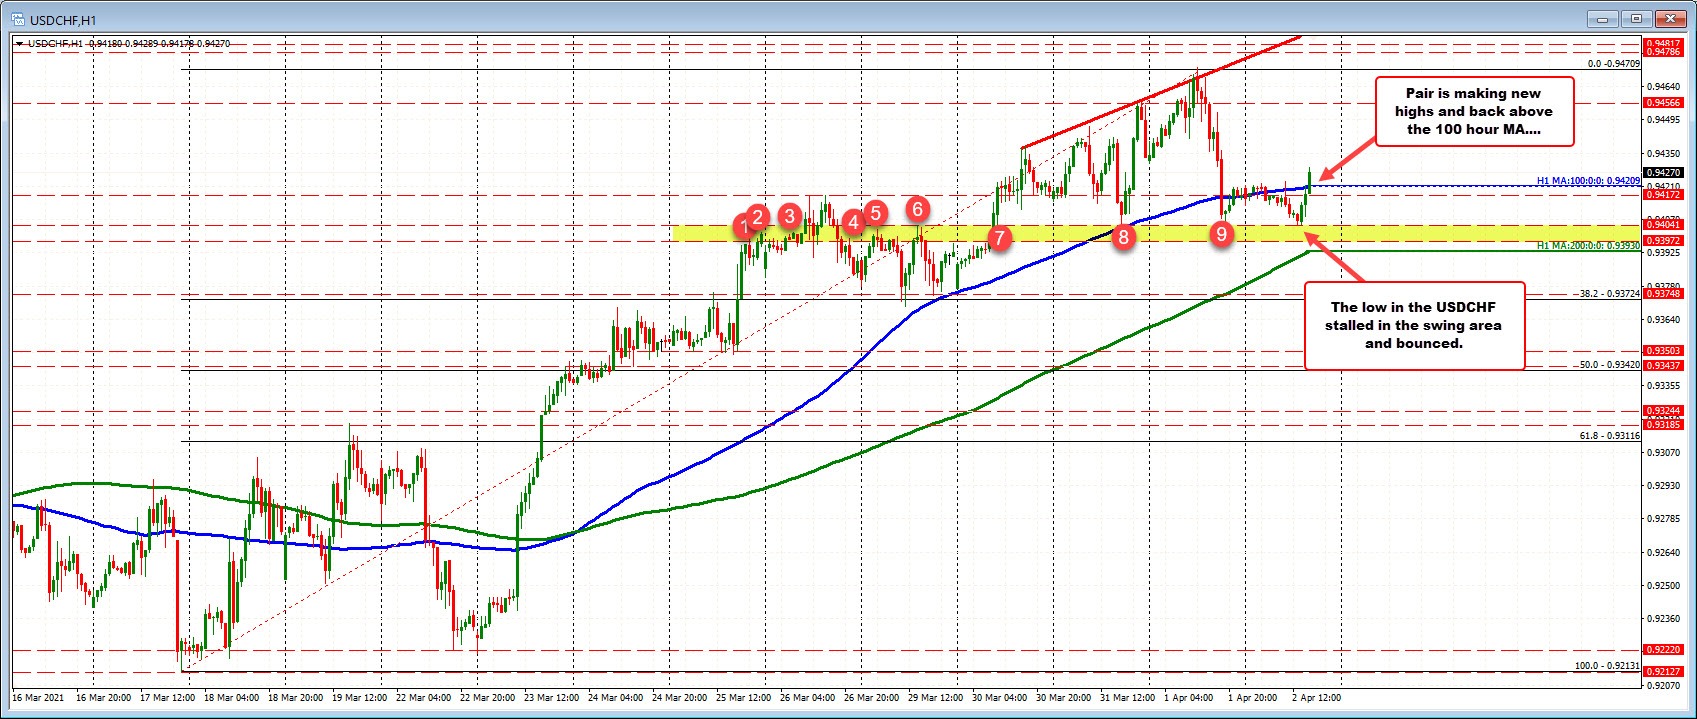
USDCHF: The USDCHF moved down to retest a swing area earlier in the day between 0.93972 to 0.94041. The low today stalled near the lows from Wednesday and Thursday near the top of that range and bounced. The jobs report took the price to a new session high and back above the 100 hour MA at 0.94209. Stay above that MA and the buyers are in full control. A move below though will need to see sellers push below the 0.9372-0.94041 area (and throw in the rising 200 hour MA as well). For now buyers in control.
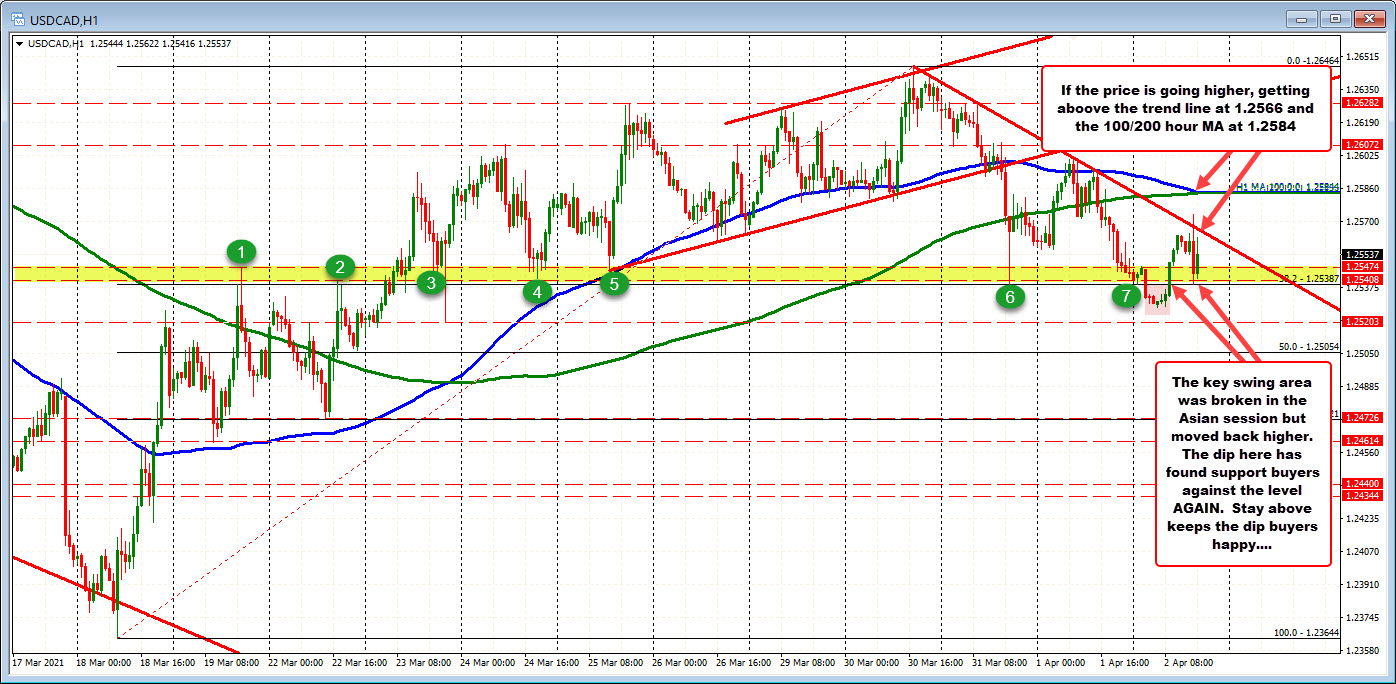
USDCAD: The USDCAD moved up and back down after the jobs report, but at the lows, the pair stalled near key support defined by the 38.2% of the move up from the March 18 low at 1.25387 and a swing area between 1.25408 to 1.25478. That keeps the buyers in play. If the buyers are to stay in control, staying above that swing area is key. ON the topside the topside trend line comes in at 1.2566 and then the converged 100/200 hour MAs are at 1.2584 and starting to dip lower. Although crude oil futures are closed, the stronger jobs report should be supportive to a recover hopeful oil market. Watch 1.25387 for bias clues.
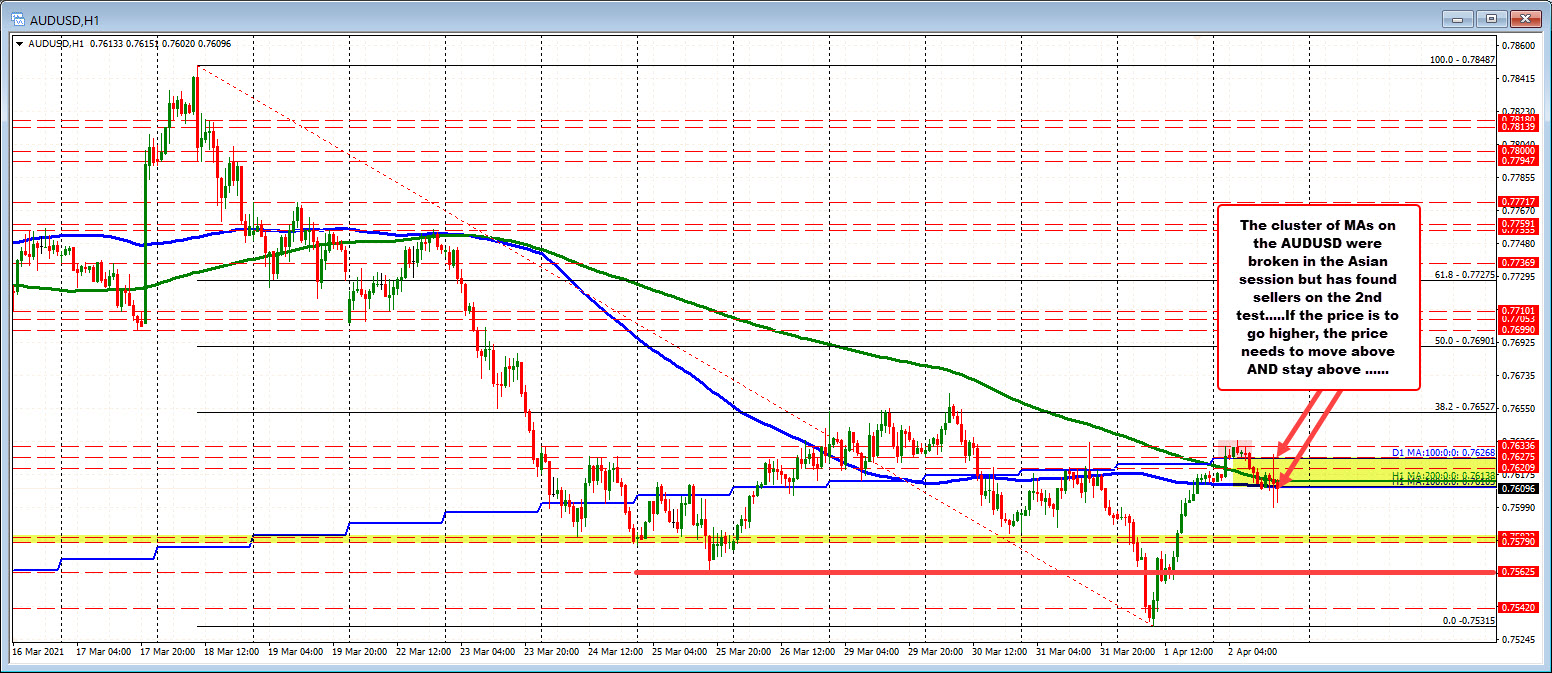
AUDUSD: The AUDUSD chart is about the cluster of MAs including the 100 hour MA at 0.7610, the 200 hour MA at 0.76138 and the 100 day MA at 0.76268. The price did move above that area in the Asian session today, but not for long. The spike high through the jobs report did try to extend back above the 100 day MA (the highest MA) but failed quickly. If the AUDUSD is to go higher, getting back above and staying above the MA cluster is needed. Absent that and the sellers are more in control.
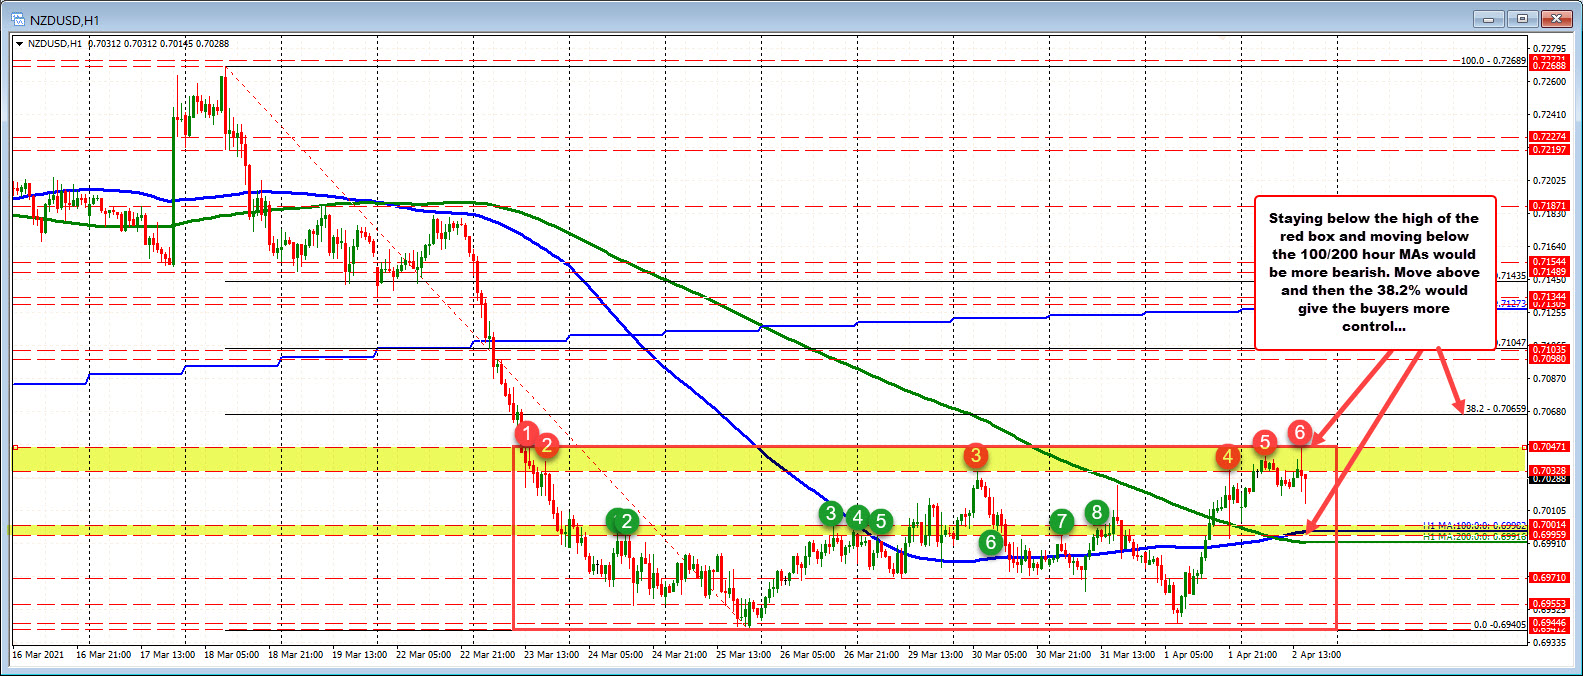
NZDUSD: The NZDUSD has been consolidating in a red box between 0.69405 to 0.70471 over the last 8+days. Getting out of that box will be eyed in the new trading week (or today). In between the extremes are the 100 and 200 hour MAs at 0.6998 and 0.69916. Until yesterday, the price was below the 200 hour MA since March 18th. Moving above has helped to tilt the short term bias more to the upside. Having said that, the 38.2% of the move down from the March 18th high comes in at 0.70659. If the buyers are to make a play, staying above the MAs below, getting above the red box and extending above the 38.2% are the bullish steps. A move back below the MAs puts the sellers back in control.
Wishing you all a happy Easter.
