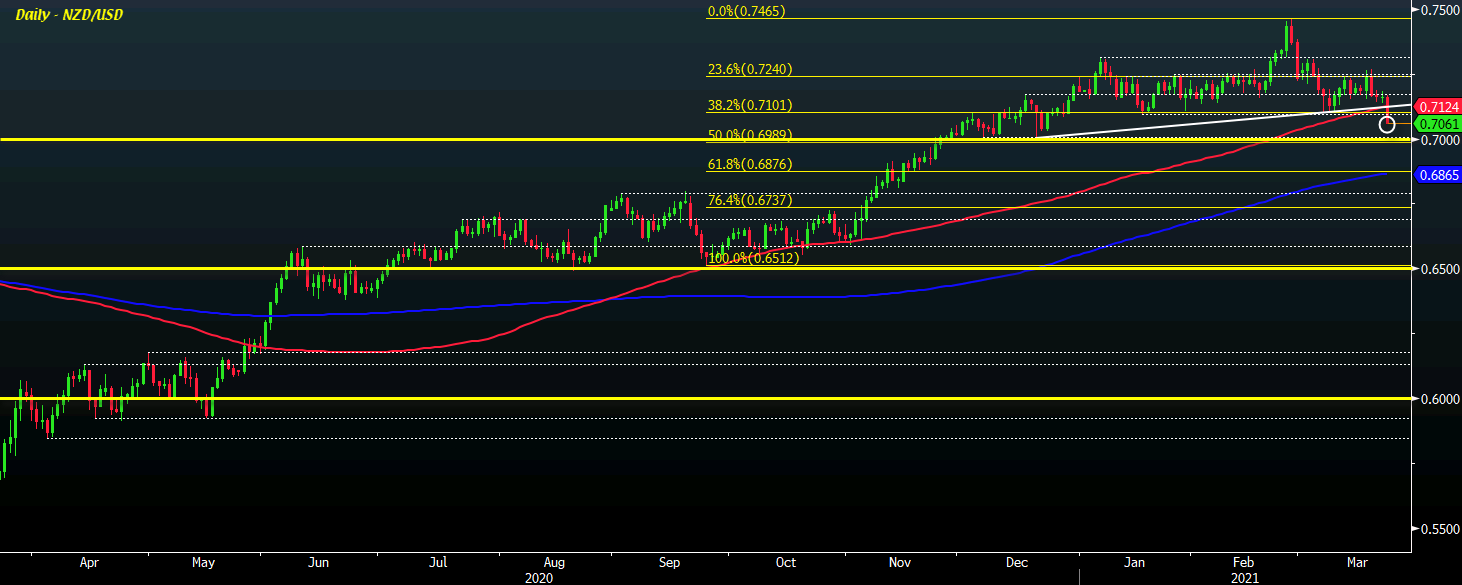
NZD/USD falls by 100 pips on the day to 0.7060
As much as the NZ government announcing curbs to ease housing prices may what kicked things off, it isn’t quite nearly a major risk trigger for the kiwi in my view. However, the chart is more telling of what is going on with the currency right now.
In particular, the break of the 100-day moving average (red line) – arguably for the first time, at least in a meaningful way, since May last year – is a key moment for sellers.
Adding to that is the failed defense by buyers at the 18 January low @ 0.7096.
This puts a lot of pressure now for buyers to try and defend the 7 and 21 December lows @ 0.7003-06 as well as the 0.7000 handle, with the 50.0 retracement level @ 0.6989 also seen nearby – that is should the downside momentum extend.
Failing which, the 200-day moving average (blue line) now seen @ 0.6865 will be the next key level to watch on the charts.
