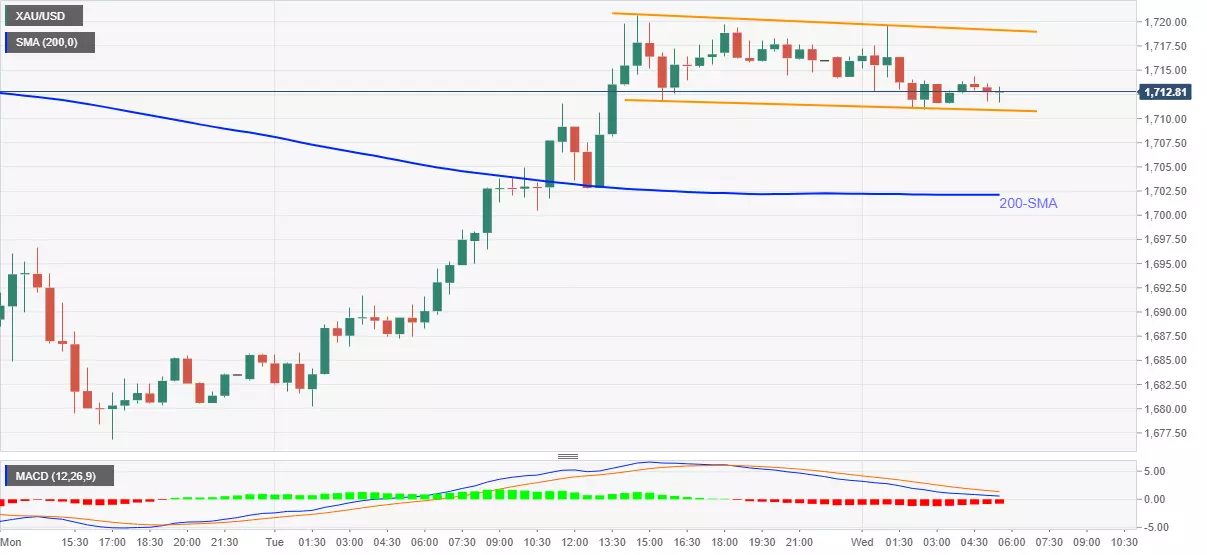
- Gold stays depressed around intraday low, trims biggest gains since January.
- Receding strength of bearish MACD, sustained trading beyond 200-SMA favor buyers.
- Buyers need to stay cautious despite confirming the bullish chart pattern unless crossing $1,765.
Gold remains pressured around $1,713, down 0.18% intraday, ahead of Wednesday’s European session. Although the bullion fades upside momentum after the heaviest run-up in two months, it does portray a bullish chart formation, called bullish flag, on the 30-minutes (30M).
Not only the bullish chart pattern but the commodity’s successful trading above 200-SMA as well as receding strength of the bearish MACD also favor gold buyers.
However, a clear upside break of $1,720 becomes necessary before directing the bulls towards confronting November 2020 lows near $1,765. During the rise, $1,740 can offer an intermediate halt.
Meanwhile, a downside break below the stated flag’s support, at $1,710 now, will have to slip beneath the 200-SMA level of $1,702, as well as the $1,700 threshold, to confirm refreshing the latest multi-day low around $1,676.
Overall, gold consolidates recent gains ahead of the key US stimulus decision but the bullish chart pattern keeps the case interesting.
Gold 30-minute chart
Trend: Further recovery expected

