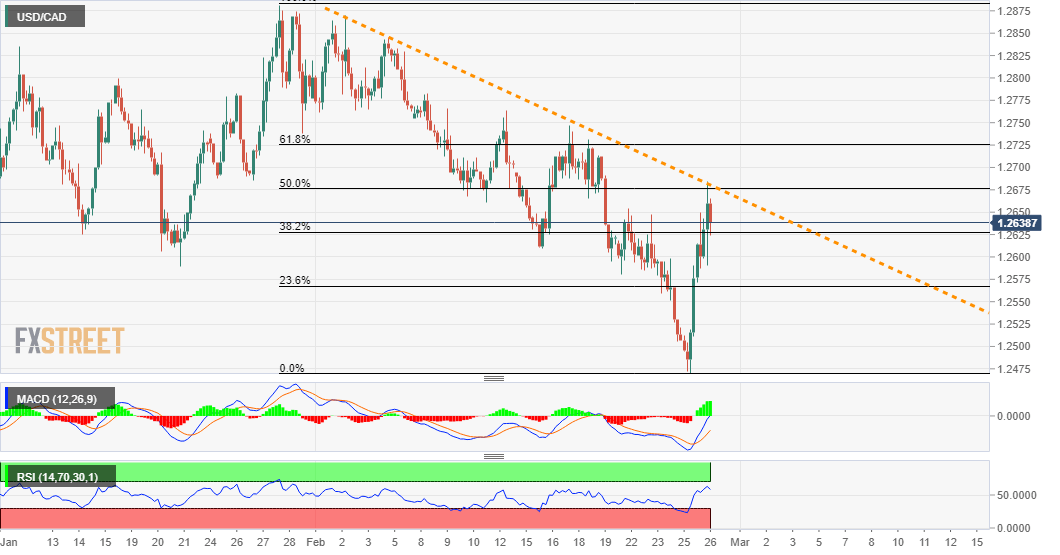
- USD/CAD gained traction for the second straight day and recovered further from multi-year lows.
- The momentum stalled near a descending trend-line/50% Fibo. confluence barrier near 1.2685.
- Mixed technical indicators on hourly/daily charts warrant caution for aggressive bullish traders.
The USD/CAD pair gained traction for the second consecutive session on Friday and built on the previous day’s solid rebound from three-year lows. The momentum pushed the pair to fresh weekly tops, albeit stalled near the 1.2685 confluence hurdle.
The mentioned region marks the 50% Fibonacci level of the 1.2882-1.2468 and monthly descending trend-line. This should now act as a key pivotal point for short-term traders and help determine the USD/CAD pair’s next leg of a directional move.
Meanwhile, bullish technical indicators on hourly charts support prospects for additional gains. That said, oscillators on the daily chart – though have been recovering from the bearish territory – are yet to confirm a near-term positive bias.
This makes it prudent to wait for a sustained strength beyond the mentioned confluence barrier before confirming that the USD/CAD pair might have bottomed out in the near-term. This, in turn, will set the stage for a further appreciating move.
The USD/CAD pair might then surpass the 1.2700 mark and aim to test the 61.8% Fibo. level, around the 1.2725-30 region. The momentum could further get extended towards the 1.2775 intermediate resistance en-route the 1.2800 round-figure mark.
On the flip side, the 1.2600 mark now seems to protect the immediate downside. This is followed by support near the 23.6% Fibo. level, around the 1.2570-65 region, which if broken decisively will negate any positive outlook for the USD/CAD pair.


 RULE-BASED Pocket Option Strategy That Actually Works | Live Trading
 This “NEW CONCEPT” Trading Strategy Prints Money!… (INSANE Results!)