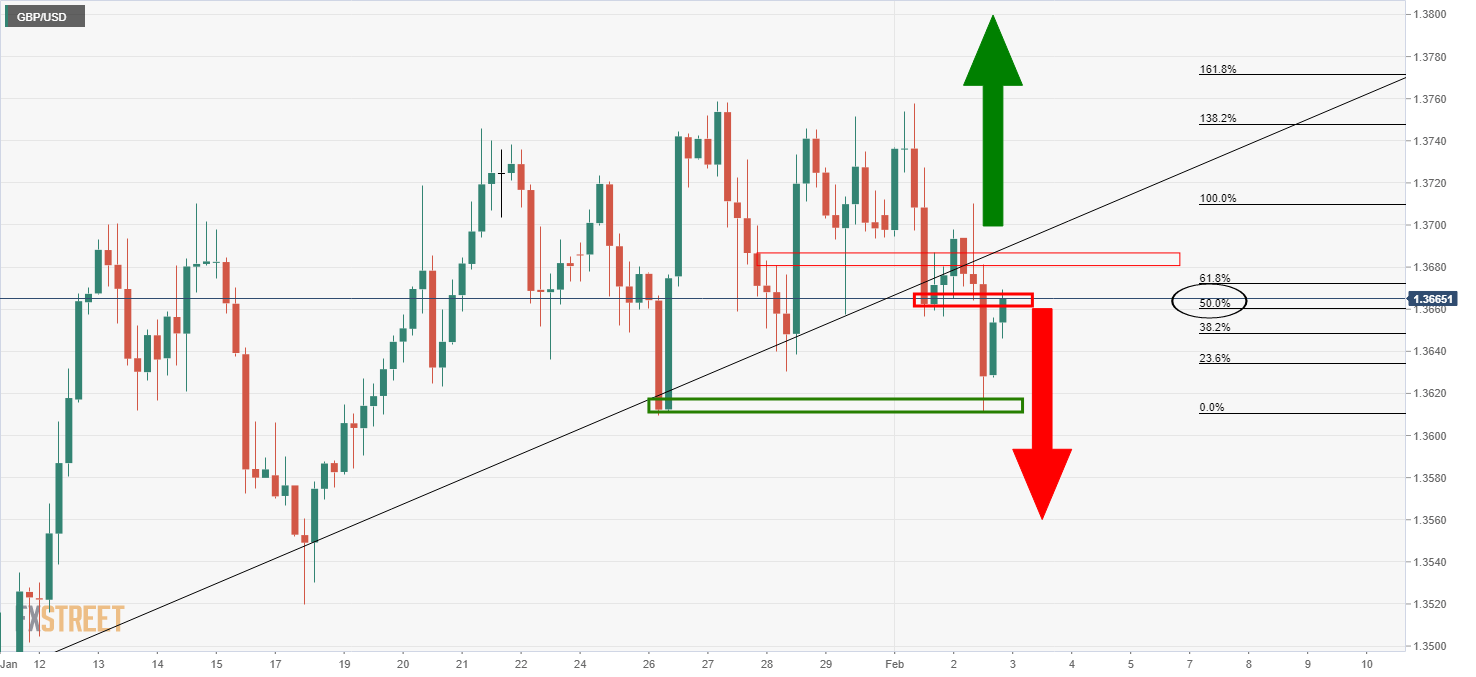
- GBP/USD bears seeking a restest of the structure.
- A confluence of the 38.2% Fibo, 21-moving average and structure is compelling support.
As per the prior analysis, GBP/USD Price Analysis: Bears seeking the next corrective leg to the downside, the price did indeed melt to the downside, however, only to spike bac to test the highest resistance within the latest downtrend.
Prior analysis, 4-hour
Live market, 4-hour
As seen, the price dropped to create new resistance structure for which the market simply burst through on the day before testing a more defined dynamic counter-trendline resistance as follows:
The price has a high probability of moving in firmly on the 38.2% Fibonacci retracement and a confluence of the 21-moving average that meets structure around the psychological and round 1.3650 level.
1-hour chart
The price has already reached a 38.2% Fibo of the move, so there is every chance that the price can continue higher and taken the bear’s commitments at trendline resistance on a break beyond the recent highs.
Nevertheless, a re-run of the level and break thereof could open the way for a deeper correction all the way to the trendline support and a 61.8% Fibonacci support level.


