NY resistance stalls the rally. New lows
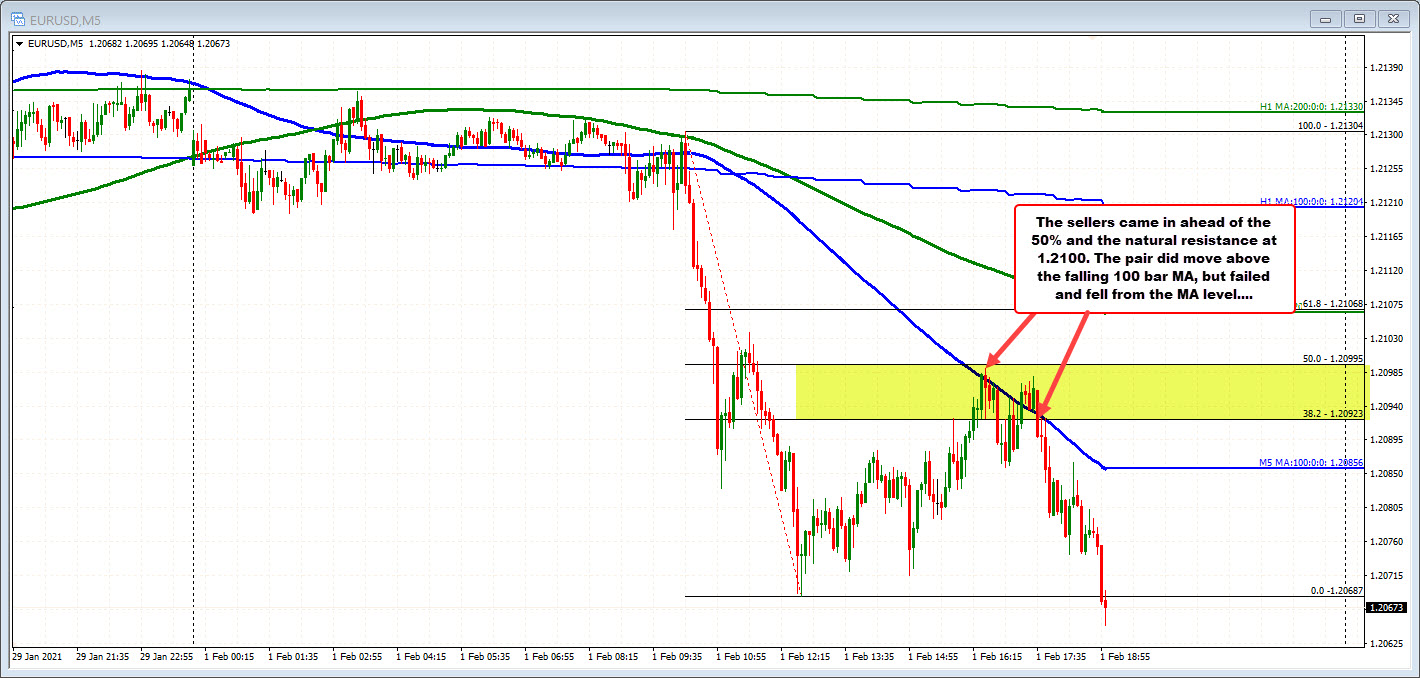
On the topside, watch the 1.21000 area for intraday bias clues. Looking at the 5 minutes chart below, the midpoint of the trend move lower today comes in at 1.20995. Just below that is the falling 100 bar moving average at 1.20982. The natural resistance at 1.21000 adds another level of potential selling pressure. If the sellers are to remain in firm control, the price should not move above that area.
The corrective price reached 1.20985 and rotated lower (see the chart below).
The price is now reaching a new session lows at 1.2064. That took out the earlier low at 1.20687. The falling 100 bar moving average on the 5 minutes chart is currently at 1.28856. Stay below that level keeps the sellers more in control.
The next target will come at the low from last week at 1.20577. Below that is the January 18 low at 1.20529
