Still down sharply
The NASDAQ index open down around -1% and tumbled lower. The low percentage the client reach -2.33% before the price started to rebound. The index has moved back toward the opening levels but still remains down on the day.
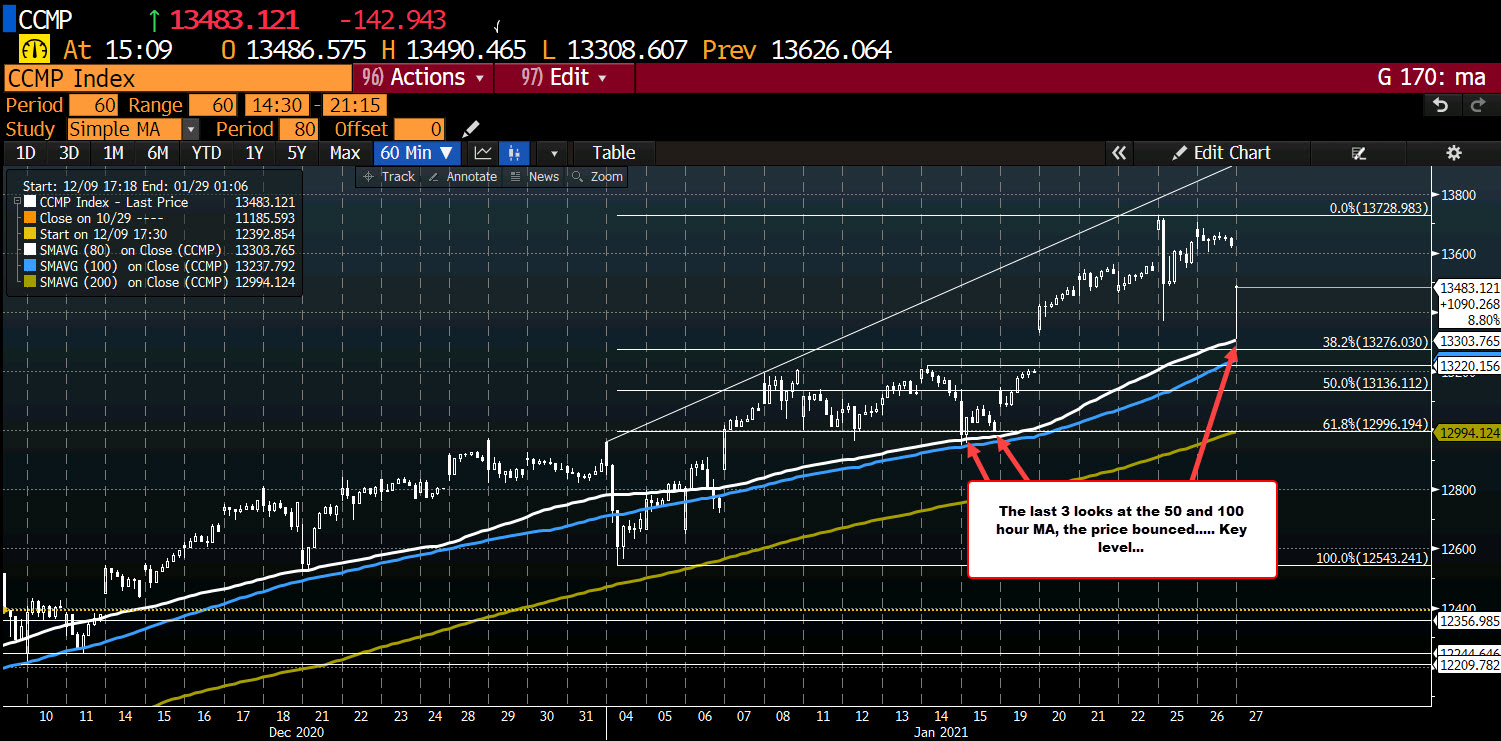
Looking at the hourly chart, at the lows the index tested the 50 hour MA at 13303.76. Just below that is a number of other technical levels including the 38.2% retracement of the move up in January at 13276.03, and the rising 100 hour moving average at 13237.792. Those levels are key levels on a further sell off. Back on January 15, the index tested both the 50 and 100 hour moving average only to bounce off the levels.
This article was originally published by Forexlive.com. Read the original article here.