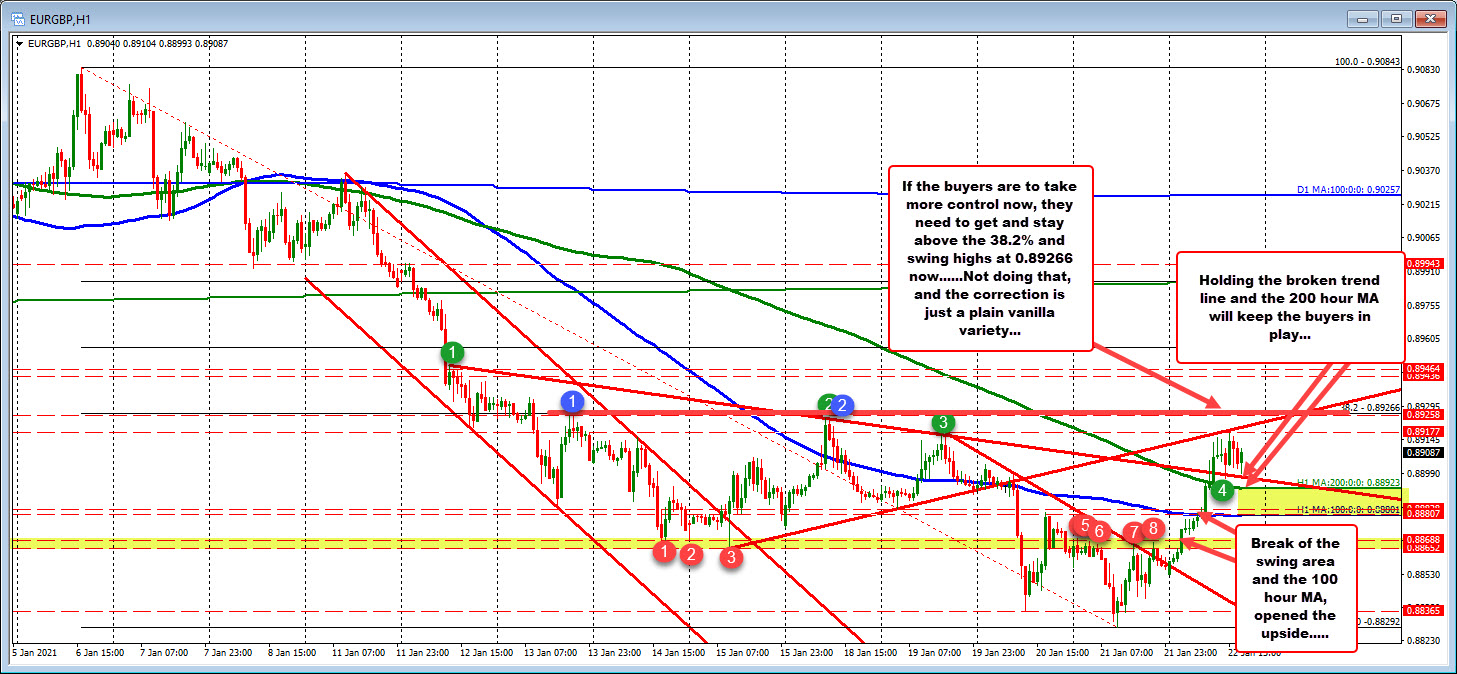
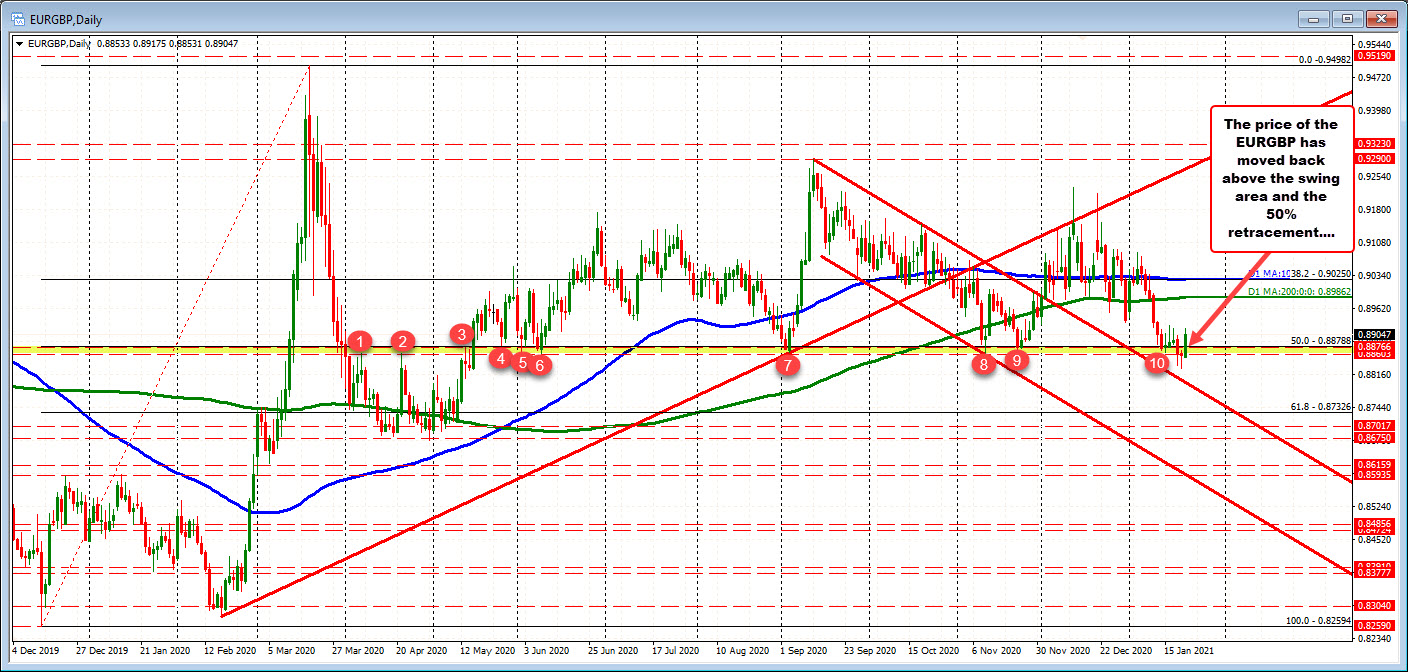
There is more work to do if the buyers are to take more control
Today (see chart above), the price has been able to get back above that area disappointing the sellers on the break, and giving the dip buyers some hope/comfort (for now at least).

Today, each of those levels were broken. The swing area was broken in the early Asian session. The 100 hour MA was broken later in that session. Sellers turned to buyers and have been able to extend above the 200 hour MA (green line) and downward sloping trend line as well. The high price today did stall near the underside of a broken trend line from earlier this week. The pair also stalled near the swing high from Tuesday at 0.89177. The high price reached 0.89175.
The current price is back down retesting the underside of the broken trend line and also the 200 hour MA. Look for buyers to lean against the level (stops below).
If the level can hold, the buyers still have work to do to give the longs more confidence technically. Specifically, getting above the 38.2% of the 2021 range is the minimum target to get to and through. Not being able to get above that level makes the rise off the low, a plain vanilla correction of the move down in January. The sellers would still hold the strongest hand (and control).
Move above, and the buyers feel better and take more back more control. PS the level is also a swing level from Jan 13 and Jan 18
