50% retracement above. 100/200 hour MAs below
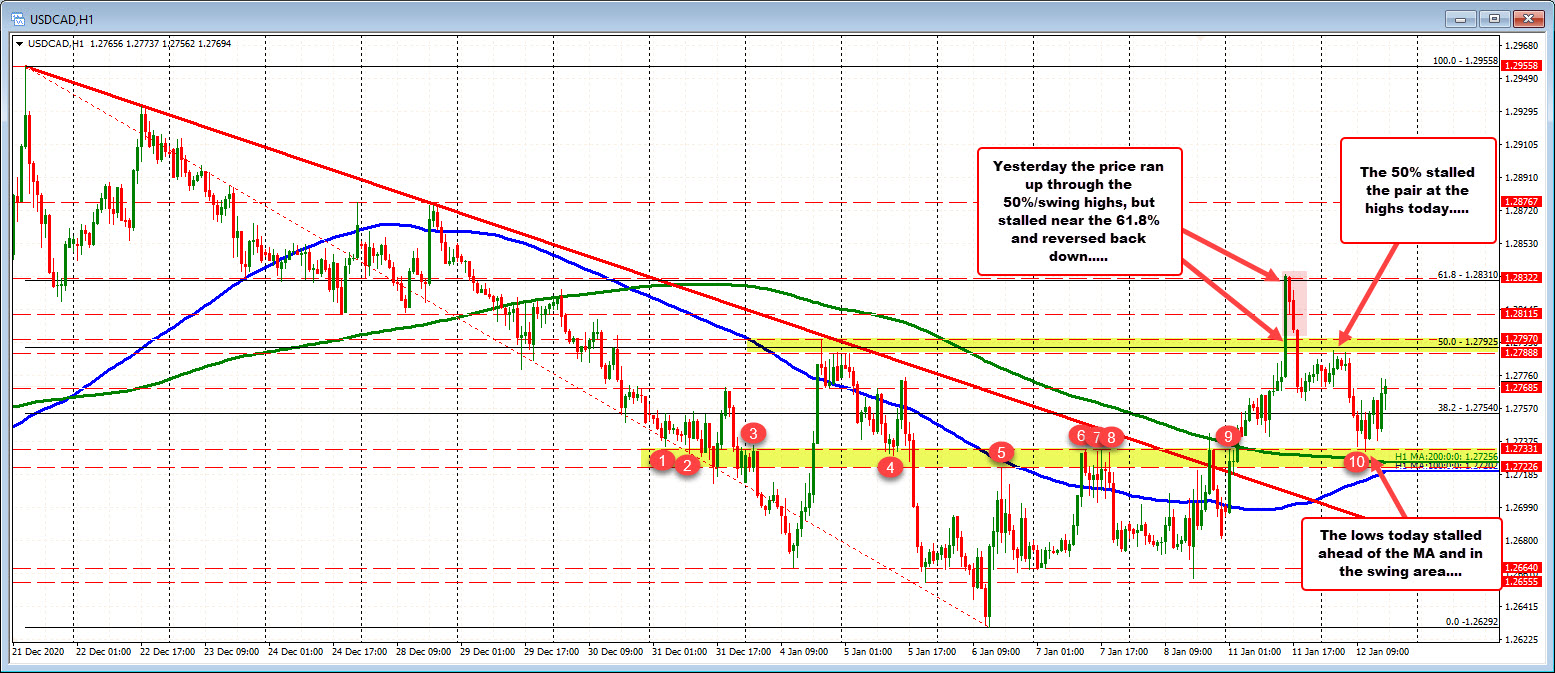
The USDCAD is trading between support defined by the 100/200 hour MA below and the 50% retracement above (resistance).
The support comes in against the 100/200 hour MAs. They currently come in at 1.2720 to 1.27256. Also near that level is a swing area between 1.2722 and 1.2733. The low today reached 1.27316 above the MAs, and just into the swing area.
The resistance today stalled just ahead of the 50% retracement of the range since the high on December 21. That level comes in at 1.27925. The high price in the Asian session reached 1.27904. Also around the 50% are swing highs from January 4, January 5 between 1.27888 and 1.27970.
The current price is trading between the two extremes at 1.2770.
Buyers and sellers are battling it out. You can flip a coin as to who has more control. Perhaps a close intraday support might be eyed at the 38.2% at 1.2754. Stay above, tilts the bias a little more to the upside.
Ultimately, traders will be looking for a break (higher or lower) with momentum on the break. Until then, the waffle and battle continues.
