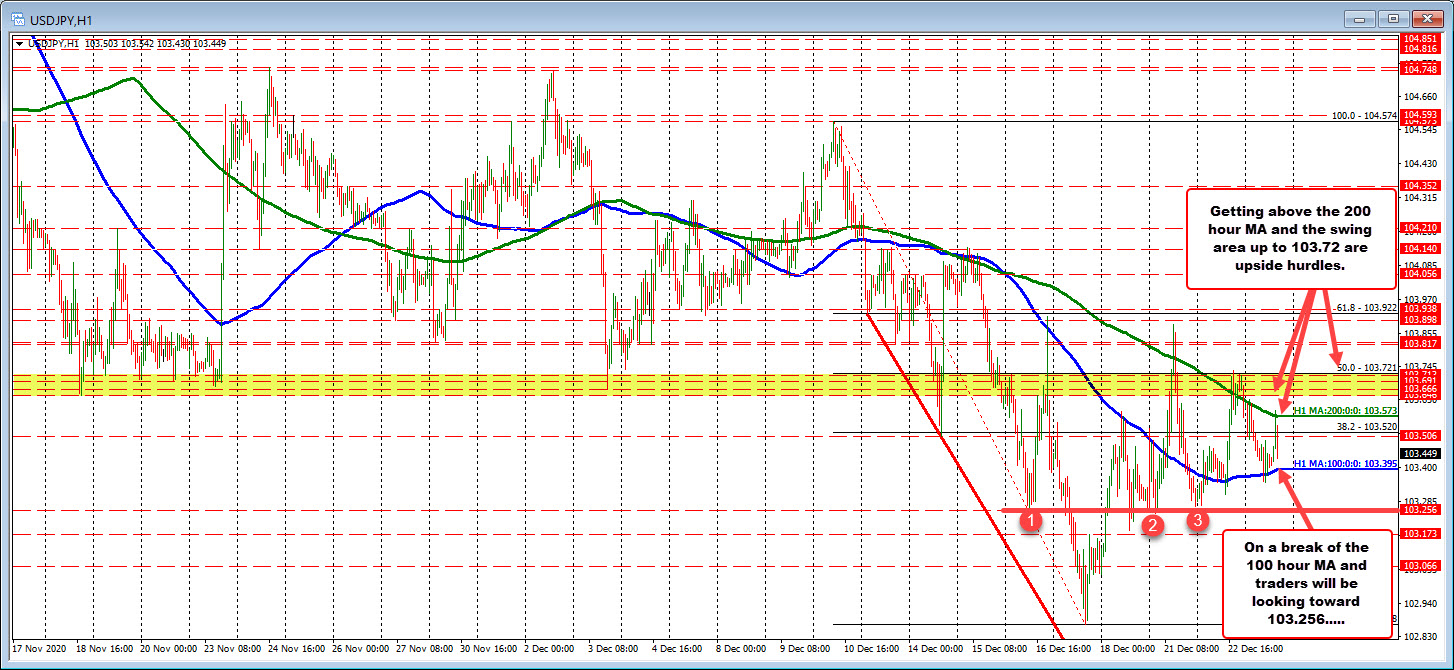
MAs converging
ThHime 100 hour moving average currently is at 103.395. The 200 hour moving averages at 103.573. Apart from some modest peaks below and above the MAs, the price has been confined by that range.
The narrow trading range and acceptance of support and resistance, suggest traders are unsure of the next push.
On a break of the topside, there is a swatch of swing levels between 103.646 and 103.713 (they go back to November so not shown in the chart above). The 50% retracement of the range since December 9 comes in at 103.721. Break the 200 hour moving average and get above that area, would open the door to the upside.
On the downside, getting below the 100 hour moving average would have traders looking toward the 103.256 area which was a low going back to December 16, December 18, December 21 and again in early trading yesterday. Fall below that level and it opens up the door for further downside. The most recent low came in at 102.868. That low was the lowest level since March 10
