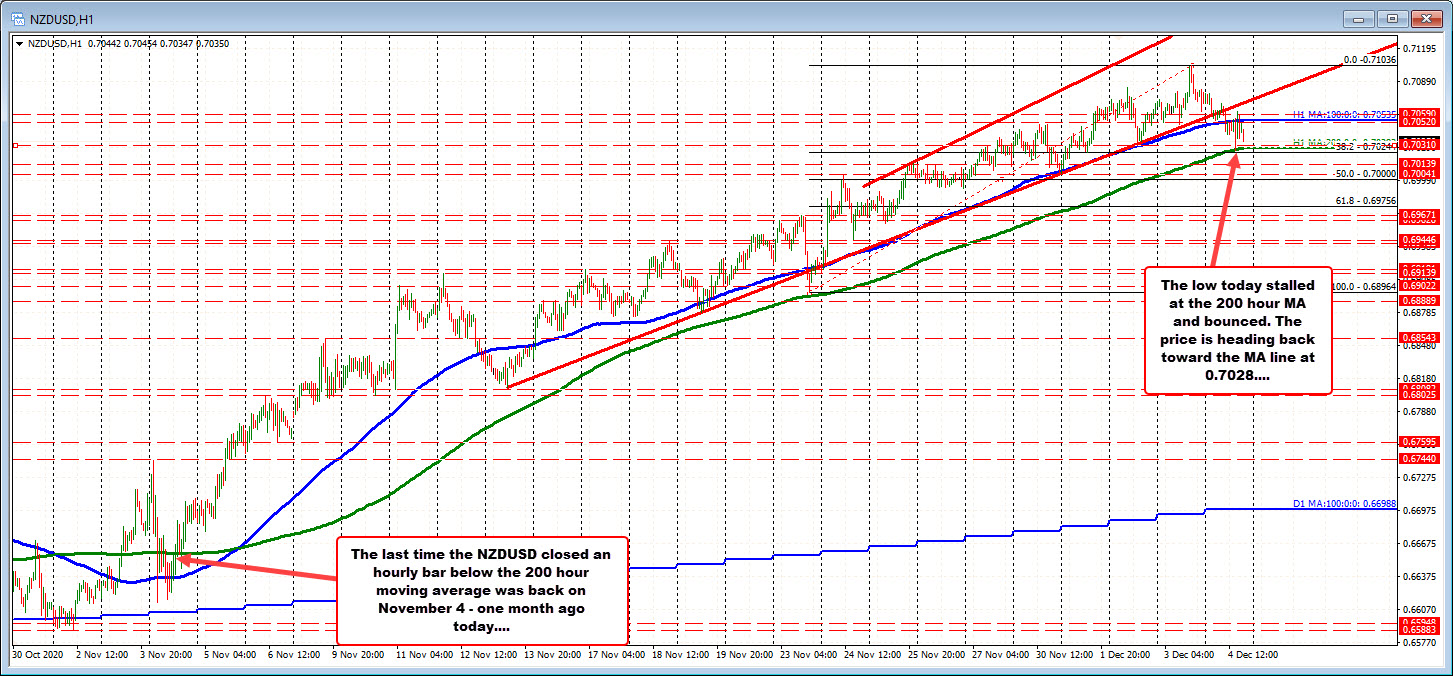
Bounced off the 200 hour MA earlier today
The NZDUSD has corrected lower in trading today after trading to the highest price since April 2018 yesterday.
The moved to the downside has taken the price below its 100 hour moving average (blue line in the chart above) and down to the 200 hour moving average (green line). The low today stalled right against the 200 hour moving average which is currently trading at 0.7028 (the MA was lower earlier today when the bottom was put in at 0.70267).
The price of the NZDUSD has not closed below the 200 hour MA since November 4 – 1 month ago today. At the time, the 200 hour MA was way down at 0.66583. The current price is at 0.70355 (the high yesterday reached 0.7136).
A move below the 200 hour MA would be a step more in the bearish direction at least in the short term (if the price stays below). Staying below the 100 hour MA will also be more bearish (although the price has traded above and below the 100 hour MA for a number of hourly bars today).
Note that although a break is bearish, the trend higher has been strong for the NZDUSD. There are plenty of downside targets that would need to be broken including the 38.2% retracement of the move up from the November 23 low at 0.7024 and the 50% retracement of the same move higher at an even 0.7000 (see chart above). Those are the minimum targets IF the bears are to take more control from what has been a strong bullish move over the last month or so.
