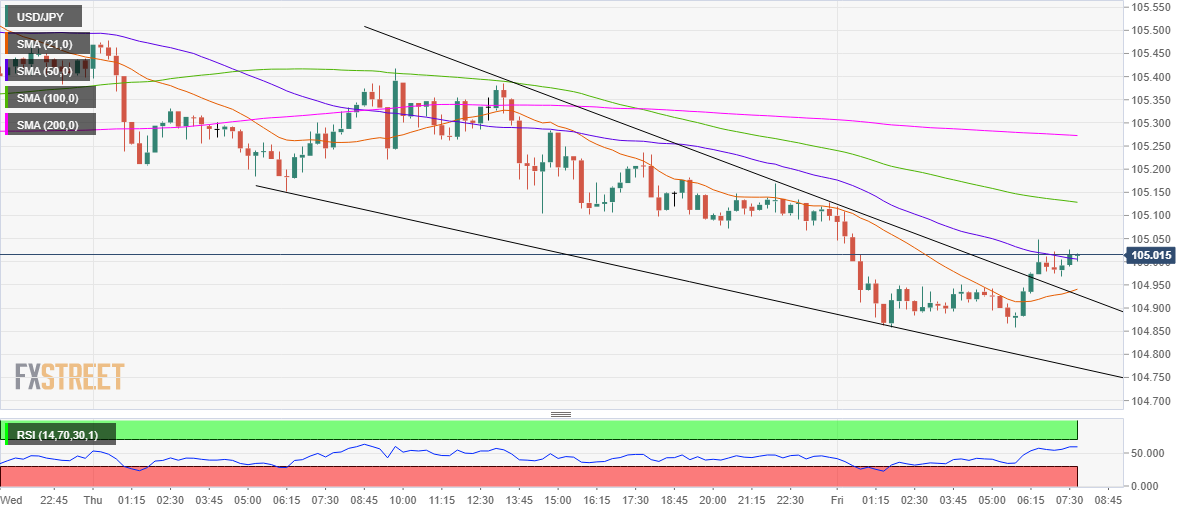
- USD/JPY bounces-off lows, re-takes 105.00 in Europe.
- Falling wedge breakout confirmed on a 15-minutes chart.
- RSI remains well within the bullish territory.
USD/JPY is trying hard to extend the bounce above the 105 level, having hit daily lows at 104.86 in the Asian trades.
The technical set up in the immediate term has turned in favor of the bulls, in the wake of a falling wedge formation confirmed on the 15-minutes chart a couple of hours ago.
Therefore, the buyers now look to test the bearish 100-simple moving average (SMA) on the said timeframe, which lies at 105.13. A break above which could call for a retest of the daily highs at 105.17.
Further up, the 200-SMA hurdle at 105.27 is likely to be on the bulls’ radars. The Relative Strength Index (RSI) has turned south but remains well above the midline, suggesting that the scope for a renewed upside remains intact in the coming hours.
At the time of writing, the spot flirts with the 50-SMA at 105.00, bidding up for a sustained move above the latter.
To the downside, 104.93 offers immediate cushion, which is the intersection of the 21-SMA and pattern resistance now turned support.
The next target for the sellers remains the daily low of 105.86, below which the psychological 105.50 level will come into play.
USD/JPY: 15-minutes chart

