Rebound in crude, lead to some profit taking
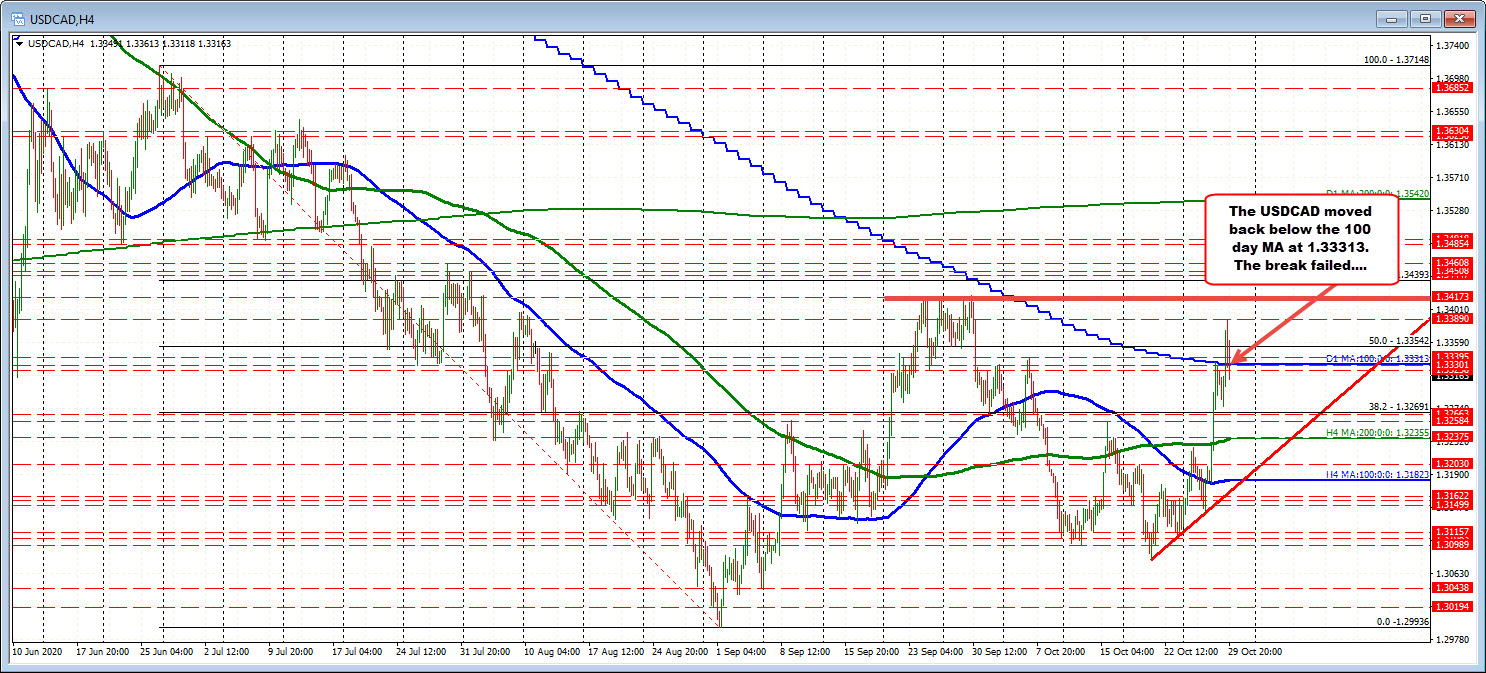
The USDCAD moved above its 100 day MA at 1.3331 earlier today (after testing and backing off on the first look). The move above was the first time since June 2020.
The high price reached 1.3389, but as crude oil bottomed and started to move back higher, the USDCAD peaked and started to move back to the downside. Now, the 100 day MA has been broken to the downside. The technical waters are tilting more to the downside below that line.
The failure is a disappointment and should put the sellers back in control against the level for now.
This article was originally published by Forexlive.com. Read the original article here.


 RULE-BASED Pocket Option Strategy That Actually Works | Live Trading
 This “NEW CONCEPT” Trading Strategy Prints Money!… (INSANE Results!)