- Gold poised for a rally towards the $2000 mark in the week ahead.
- Bulls charted a classic falling wedge breakdown on the daily chart.
- A break above 50-DMA resistance is critical to take on the further upside.
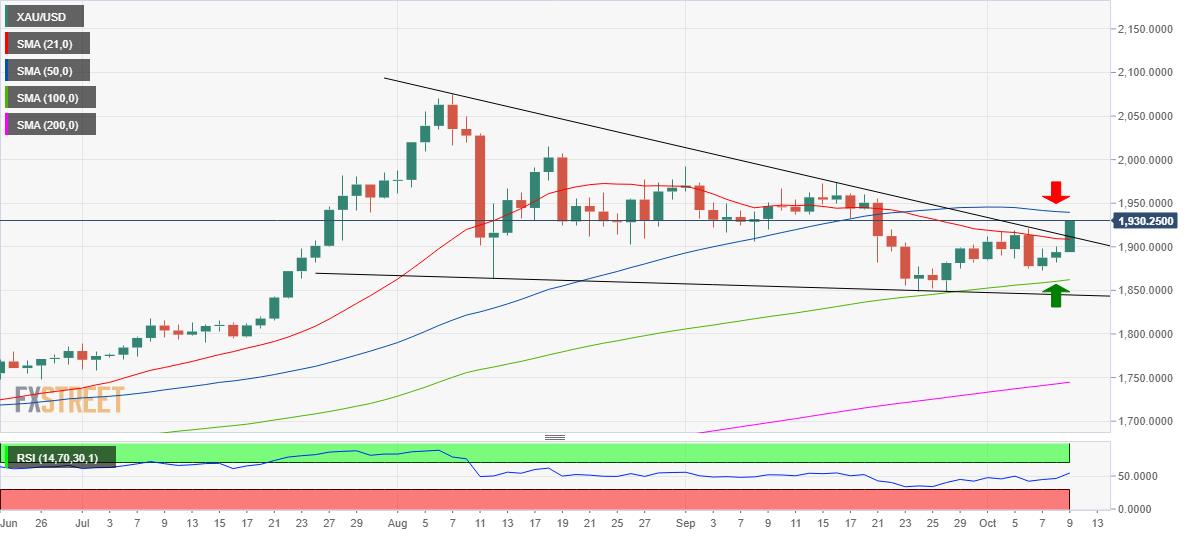
Following the settlement at two-week highs of $1930, Gold (XAU/USD) remains poised to extend the bullish momentum into a fresh week, courtesy of a classic technical breakout on the daily chart.
On Friday, the metal finally delivered a daily closing above the critical upside barrier at $1911, the confluence of the 21-daily moving average (DMA) and falling trendline resistance, yielding a falling wedge breakdown.
The technical breakout added credence to the bullish reversal from the two-month lows of $1849, opening doors for a retest of the $2000 mark in the coming week.
However, it’s critical for the bulls to take out the fierce 50-DMA hurdle $1939.50. The 14-day Relative Strength Index (RSI) pierced above the midline, pointing north at 54.55, indicative of more scope to the upside.
Alternatively, any profit-taking declines could be limited by the initial support at the abovementioned resistance-turned-support at $1911, below which the 100-DMA cap at $1862 could come back into play ahead of the two-month troughs.
All in all, the path of least resistance is to the upside.
Gold: Daily chart

