
- Gold’s hourly chart shows a bearish reversal pattern.
- The breakdown has exposed the recent low of $1,948.
Gold is currently trading at $1,893 per ounce, representing a 0.65% drop on the day.
The decline has confirmed a rising wedge breakdown on the hourly chart. The bearish reversal pattern indicates that the recovery rally from the Sept. 28 low of $1,948 has ended, and the sell-off from the Sept. 16 high of $1,973 has resumed.
As such, the yellow metal could re-test $1,948. On the way lower, the higher low of $1,880 created on the hourly chart on Sept. 30 could offer support.
The bearish bias would be invalidated if prices find acceptance above Thursday’s high of $1,912.
Hourly chart
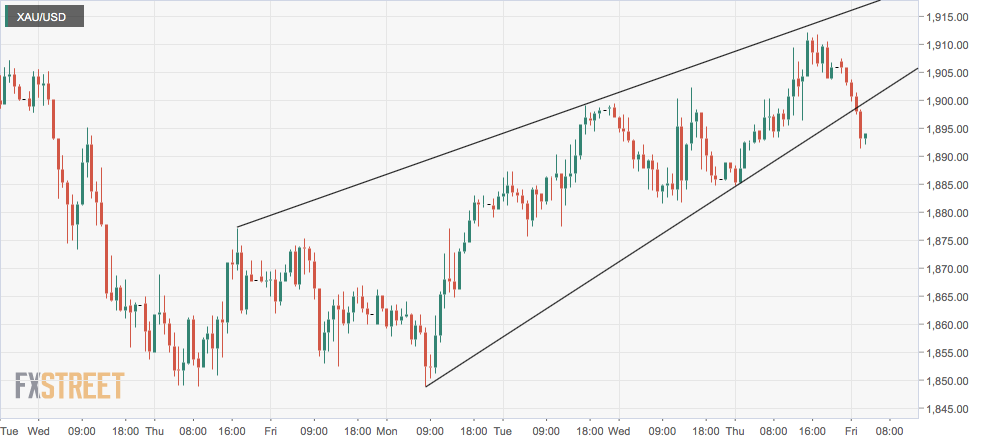
Trend: Bearish
Technical levels
This article was originally published by Fxstreet.com. Read the original article here.

 #optionbuying #optionstrading#trading#nifty #scalping #sharemarket #shorts #ytshorts