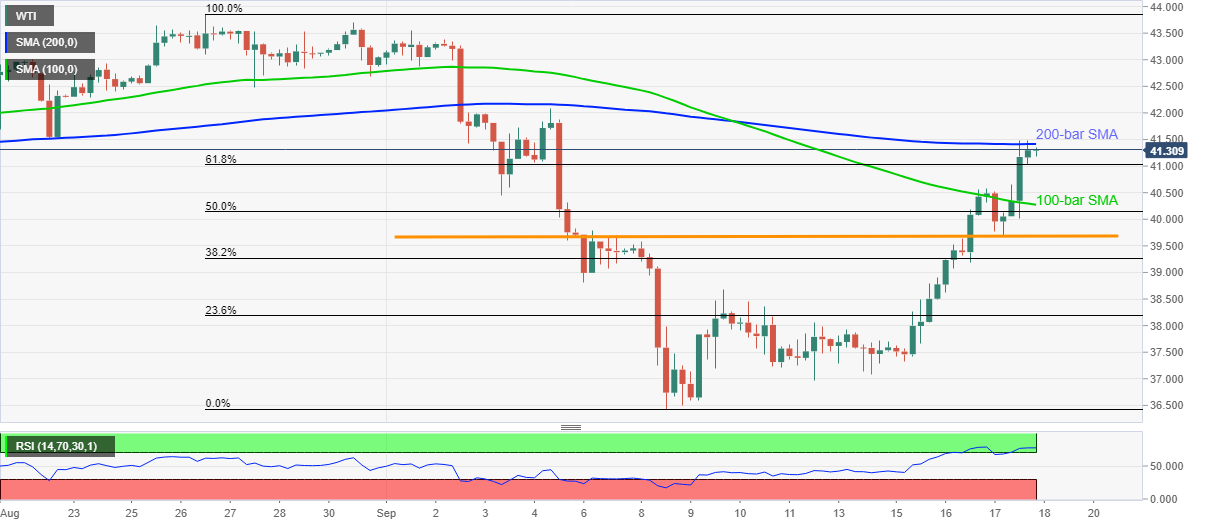
- WTI fizzles the run-up above $40.00 after flashing two-week high of $41.48.
- Overbought RSI conditions, strong SMA probe the bulls.
- Sellers await a clear downside break of 61.8% Fibonacci retracement level around the $41.00 area.
WTI consolidates the recent gains to $41.48 within a choppy range above $41.00, currently up 0.20% around $41.30, during the early Friday morning in Asia. The black gold surged to the highest since September 04 the previous day after breaking 100-bar SMA. Though, the 200-bar SMA seems to restrict the commodity’s latest up-moves amid overbought RSI conditions.
Considering the strength of the 200-bar SMA and signals of a pullback marked by the RSI, sellers remain hopeful. The same push them to look for entry if oil prices drop below the 61.8% Fibonacci retracement level of August 26 to September 08 downside, near $41.00.
In doing so, WTI will become vulnerable to revisit the 100-bar SMA level of $40.27 before catching a breather around the $40.00 threshold.
It should, however, be noted that a nine-day-old horizontal support linear $39.70 may question the energy bears after $40.00.
Meanwhile, an upside clearance of $41.42 figures, comprising 200-bar SMA, will aim for September 04 top of $42.07 before the August 27 bottom near $42.50 challenge further rise.
In a case where the WTI bulls dominate past-$42.50, August month’s top, also the highest since March 05, surrounding $43.85, will be in the spotlight.
WTI four-hour chart
Trend: Pullback expected

