AUD/JPY didn’t make a significant move and USD/MXN keeps breaking down
It was a whirlwind week but if you take a step back, there were really three themes: Tech stock weakness, a drop in sterling and oil softness.
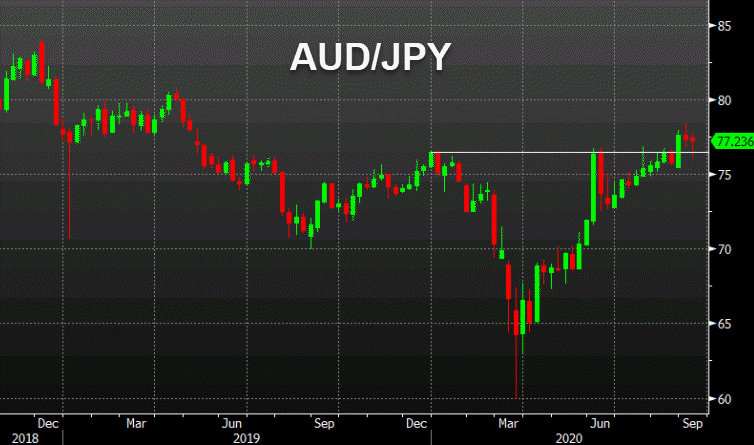
You can strip all those things out as idosyncratic factors and then you’re left looking at something like AUD/JPY. The weekly chart there shows not much of anything happening. There was an extension of the breakout last week that faded and some volatility this week. Importantly, it held above the year-to-date highs.
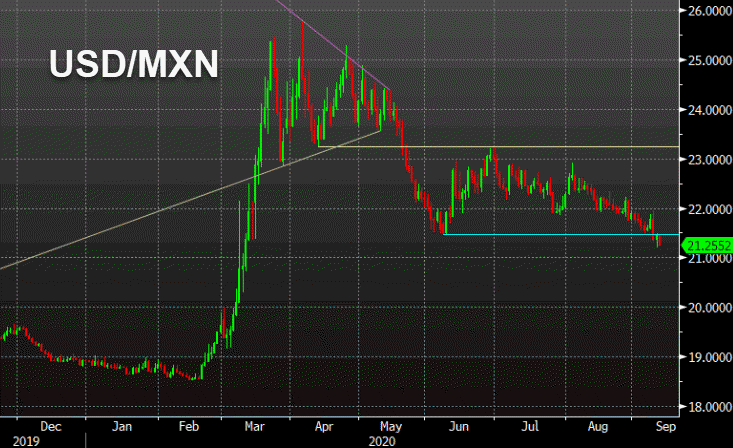
Another risk barometer that I continue to watch is USD/MXN. I’m decidedly bearish on this pair for a number of reasons that I’ve outlined over the past few weeks. Despite all the turmoil and USD strength this week, it has broken down.

Another round of equity weakness could certainly overwhelm the mood in FX but I’m starting to think we will look back on this episode as an option-driven mess, not a significant top.
