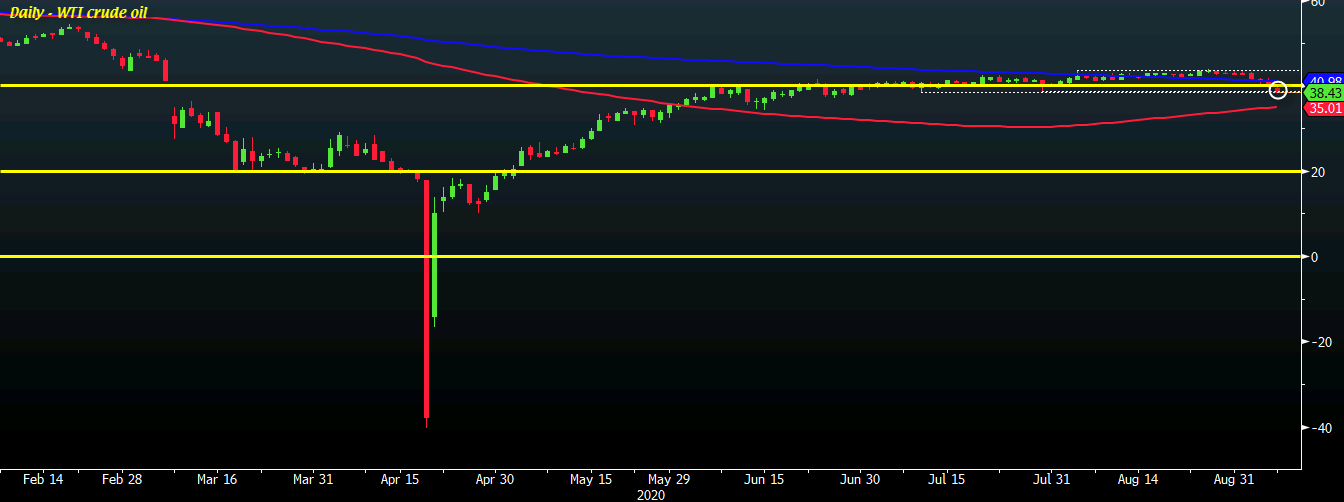
Oil down by a little over 3% to its lowest level since 29 June
The technical story in oil has been a really interesting one throughout August trading until now. Buyers kept a break above $40 but have been unable to firmly break above the 5 August high @ $43.52 despite keeping above the 200-day MA (blue line).
The exhaustion in keeping price action above that level and also some added uncertainty surrounding the outlook – flagging demand – has slowly weighed on oil and we are now potentially starting to see a stronger correction play out.
The break under the 200-day MA and close below $40 yesterday was a key technical signal and sellers are running trying to run with that as risk skids today.
European stocks are dragged lower as US futures also turn tail with S&P 500 futures having been up by ~0.7% earlier and are now down ~0.2% instead.
Nasdaq futures were flat at one point in early trading today but are now down ~1.4%.
The sour mood is also weighing on oil a little as price now falls below support from the 10 and 30 July lows @ $38.54-72 to its lowest level since 29 June.
The 26 June low @ $37.01 will offer some support for buyers to lean on should the drive lower continue, but the 100-day MA (red line) will be a key technical test in the bigger picture to see how low will this pullback go.
