What levels are in play for the EURUSD
The EURUSD this week, moved up on Monday and Tuesday and in the process moved to the highest level since May 2018. The high price reached 1.1965.
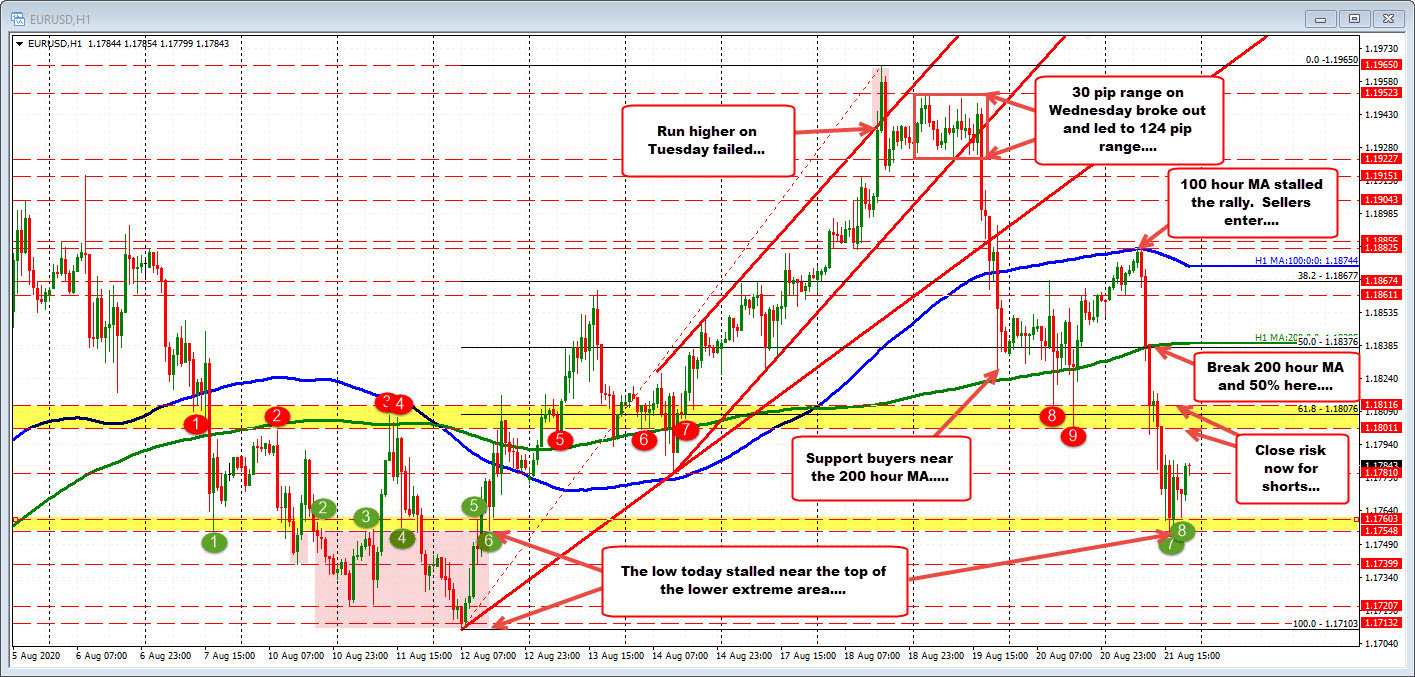
Looking at the hourly chart below, the price cracked above a topside channel trendline in the process, but failed on the break.
On Wednesday the start of the New York session had the range for the EURUSD at only 30 pips. The market was non-trending . However, we know that non-trending transitions to trending. By the end of the day the range had extended to 125 pips as selling intensified through swing levels, trend lines and the 100 hour moving average (blue line in the chart above). The price low on Wednesday did stall just ahead of its 200 hour moving average (green line in the chart above).
On Thursday, choppy price action with the price trading between the broken 38.2% retracement at 1.1867 and the 1.1800 level. The price settle between the 100 hour moving average above at 1.1879 and the 200 hour moving average below at 1.1830.
On Friday, the price action initially moved up to test its 100 hour moving average but found willing sellers against the level.
The subsequent move lower saw the pair break back below the 200 hour moving average (green line) and 50% retracement of the move up from the August 12 at 1.1838. Selling intensified and the fall did not stall until 1.1753. New lows for the week were made after the break of the 1.1801 level. That level represents the low of a swing area between 1.1801 and 1.18116. In between sits the broken 61.8% retracement of the range since August 12 at 1.18076.
The low tested another swing low area going back to August 6 between 1.17548 and 1.17603.
In the new trading week, the 1.17548 to 1.17603 will represent close support. a move below will enter the lower extreme area that extends down to 1.17103.
On the topside getting above the 1.18116 level will be needed to tilt the bias more to the upside and have traders looking back toward the 50% retracement and 200 hour moving average at 1.1838 area. Move above that level in the bullish bias increases.
