200 hour MA and trend line stalled the fall. Keeps the buyers in control.
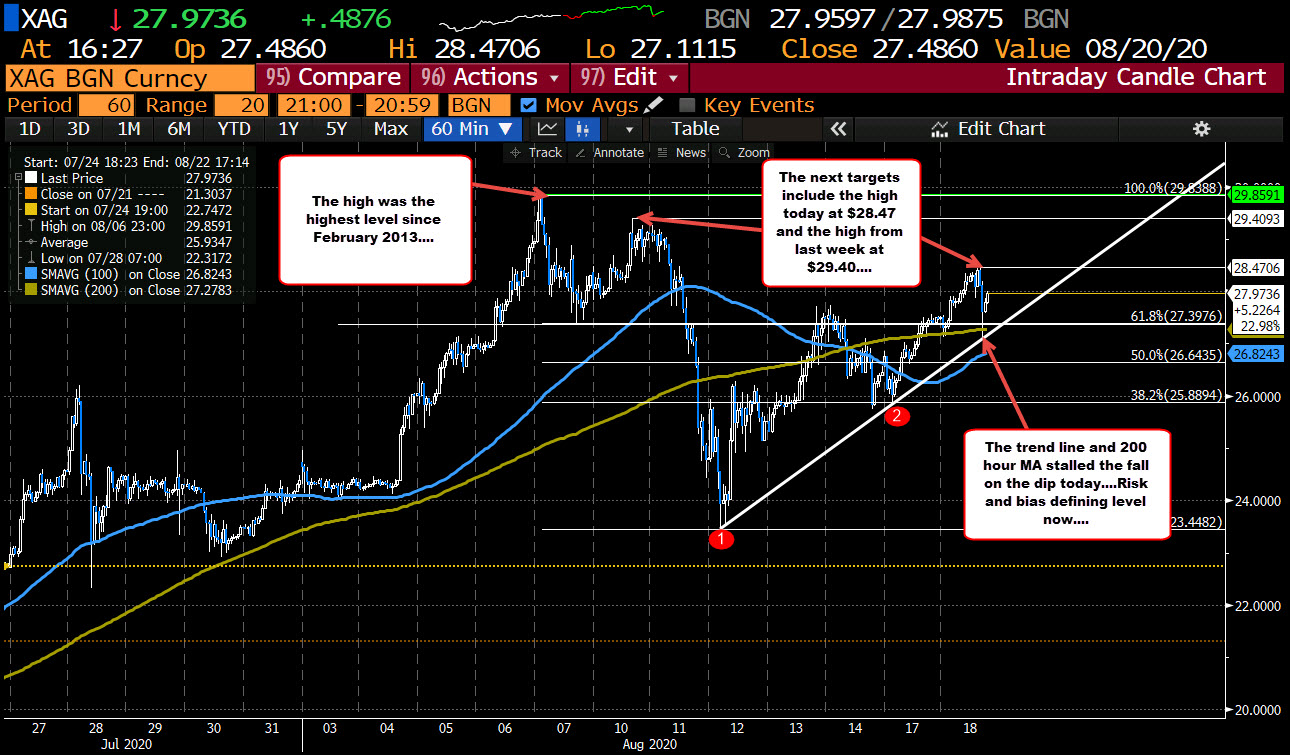
The price of silver has had an up and down day today but is currently trading up $0.60 or 2.2% at $28.09. The high for the day reached $28.47, while the low extended to $27.11.
Technically, the low in the Asian session stalled right at the 200 hour moving average and bounced higher (green line in the chart above). The corrective low in the New York session did break below the 200 hour moving average currently at $27.27 but found support buyers against the upward sloping trend line on the hourly chart at $27.11.
The bounce off that level (and move back above the 200 hour moving average) keeps the buyers more in control. It also solidifies the moving average and trend line as support/risk defining/bias defining level. Stay above and the buyers remain in control. Move below and we should see further selling.
The targets on the upside now include the high for the day at $28.47 and the high from last week at $29.40. The high from August 7 was the highest level going back to February 2013. That level reached $29.84 – just short of the natural $30 level.
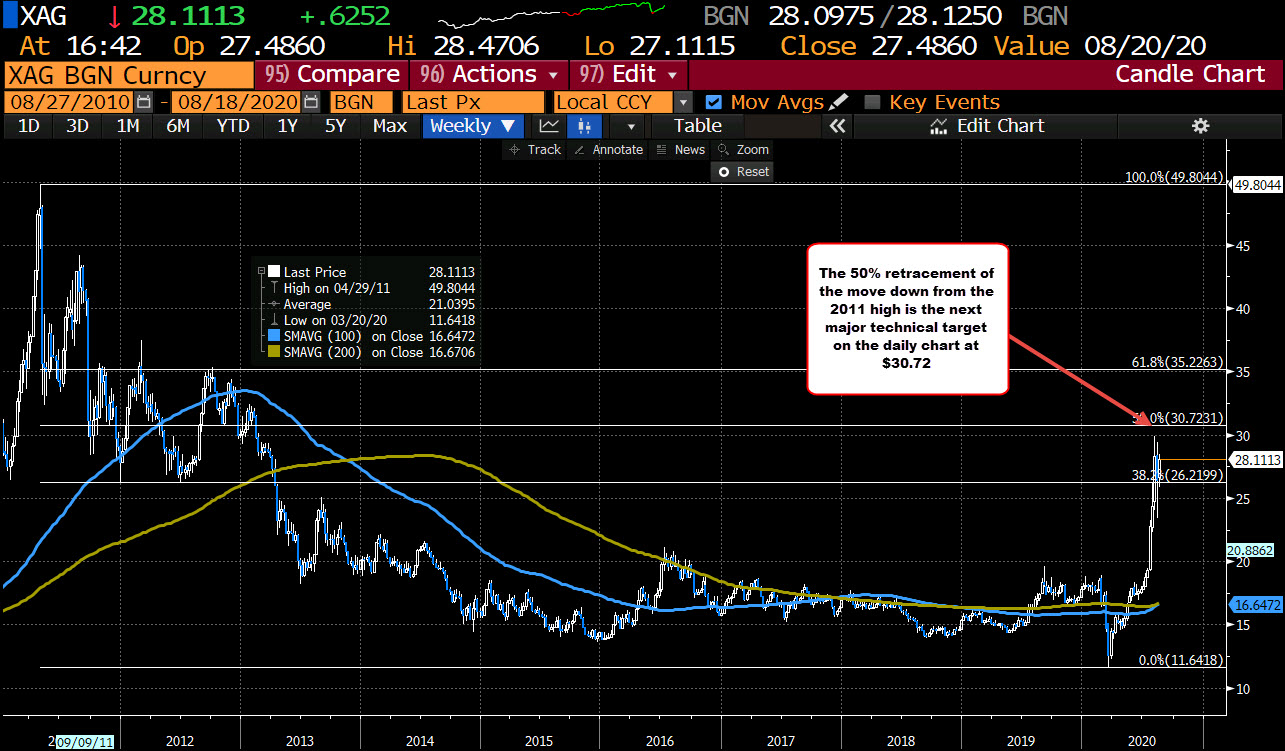
The all-time high price for silver was reached in 2011 at $49.80. The 50% retracement of the move down from the high to the lowest low reached in March of this year comes in at $30.72.

