- The DXY is 1.72% lower over the week as the index continues to fall on Friday.
- The US continues to struggle with the COVID-19 pandemic and a multitude of issues.
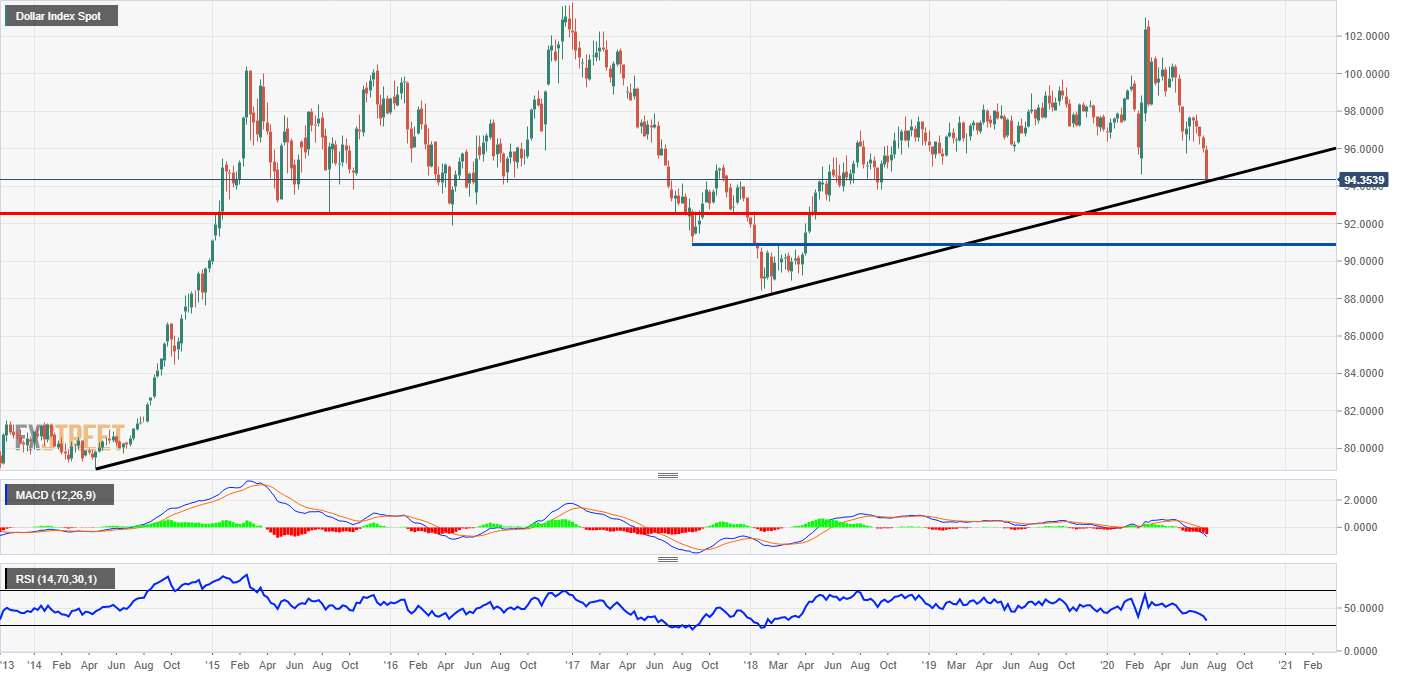
Dollar Index weekly chart
The dollar’s spectacular demise is continuing into the end of the week. The greenback has even lost ground against the Japanese yen which has been holding in a consolidation range for a while. On some of the major currency pairs, the price is heading to some big levels on the weekly charts and the dollar index is no different.
The chart shows the index is heading to a big trendline on the weekly timeframe. This trendline spans six years and could be a support zone for the oversold dollar. Below this level, there is another key zone at the red horizontal line at 92.45 and then again lower at 90.80. The major swing low is holding at 88.25 and a break of this level would take the index to its lowest level in ten years.
The indicators are obviously in a very bearish place. The MACD histogram is firmly in the red and the signal lines are also under zero. The Relative Strength Index is heading to the oversold area but there is still some space to the downside.

