
- USD/CAD remains in the range between 1.3565 and 1.3590 since Thursday.
- A three-week-old falling trend line adds to the upside barriers.
- 38.2% Fibonacci retracement offers immediate support ahead of 200-day SMA.
USD/CAD stays sluggish around 1.3580 during the early Asian session on Monday. Despite its latest efforts to cross 21-day SMA, the loonie pair has been trading in a 25-pips area off-late.
As a result, the sellers may target 38.2% Fibonacci retracement of June month’s upside, near 1.3560 as immediate support. However, a confluence of 50% Fibonacci retracement and 200-day SMA, around 1.3515/10, could restrict the pair’s further weakness.
In a case where the bears sneak in to drag the quote below 1.3500 mark, 61.8% Fibonacci retracement level of 1.3468 will be on their radars.
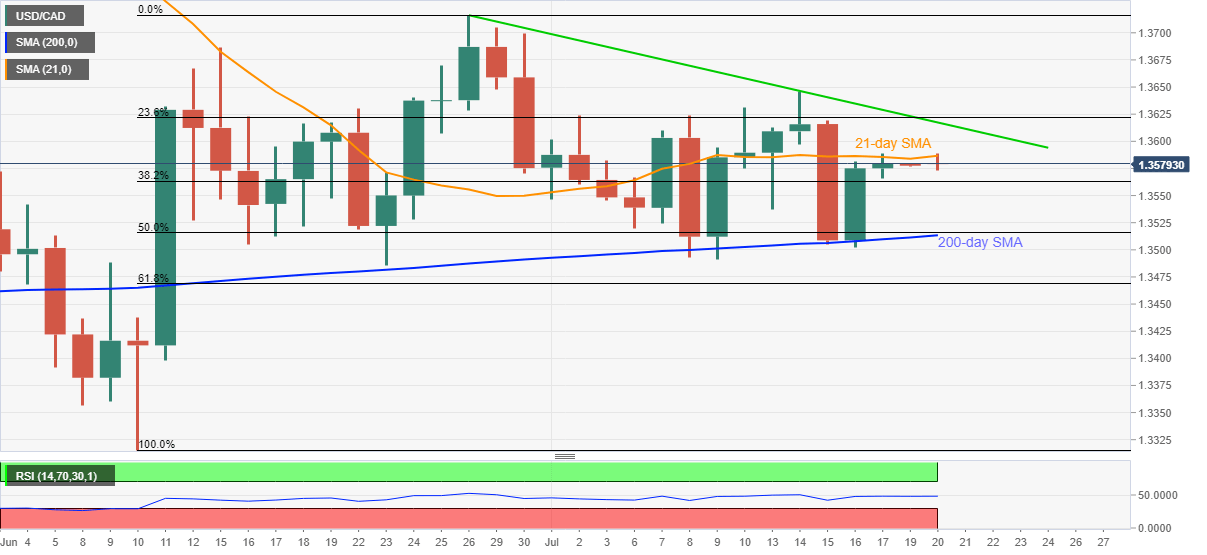
Alternatively, a clear break above 21-day SMA level of 1.3587 won’t open the doors for the bulls as a downward sloping trend line from June 26, close to 1.3620, becomes the tough nut to crack.
USD/CAD daily chart
Trend: Sideways